Fig. 14
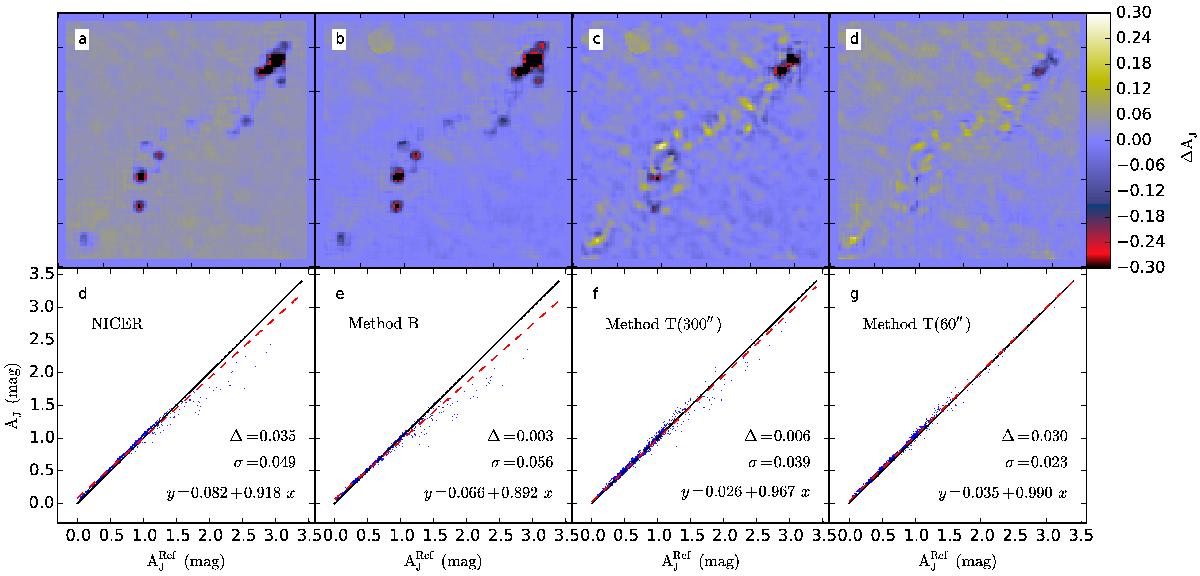
Residuals for extinction maps calculated for the Pipe Nebula at a resolution of 300″. The reference is the Lombardi et al. (2006) NICER map that has been convolved to the resolution of 300″ (see text). Residuals are shown for NICER (frame a)), Method B (frame b)), and Method T (frames c) and d)). Method T uses the NICER map of frame a (frame c)) as a template of the small-scale structure or the Lombardi et al. (2006) NICER map at the full 60″ resolution (frame d)). Frames d)–g) show the corresponding data as scatter plots with the reference data on the x-axis. The maps are in Galactic projection and have a size of 3.22 × 3.22 deg.
Current usage metrics show cumulative count of Article Views (full-text article views including HTML views, PDF and ePub downloads, according to the available data) and Abstracts Views on Vision4Press platform.
Data correspond to usage on the plateform after 2015. The current usage metrics is available 48-96 hours after online publication and is updated daily on week days.
Initial download of the metrics may take a while.