Free Access
Fig. 13
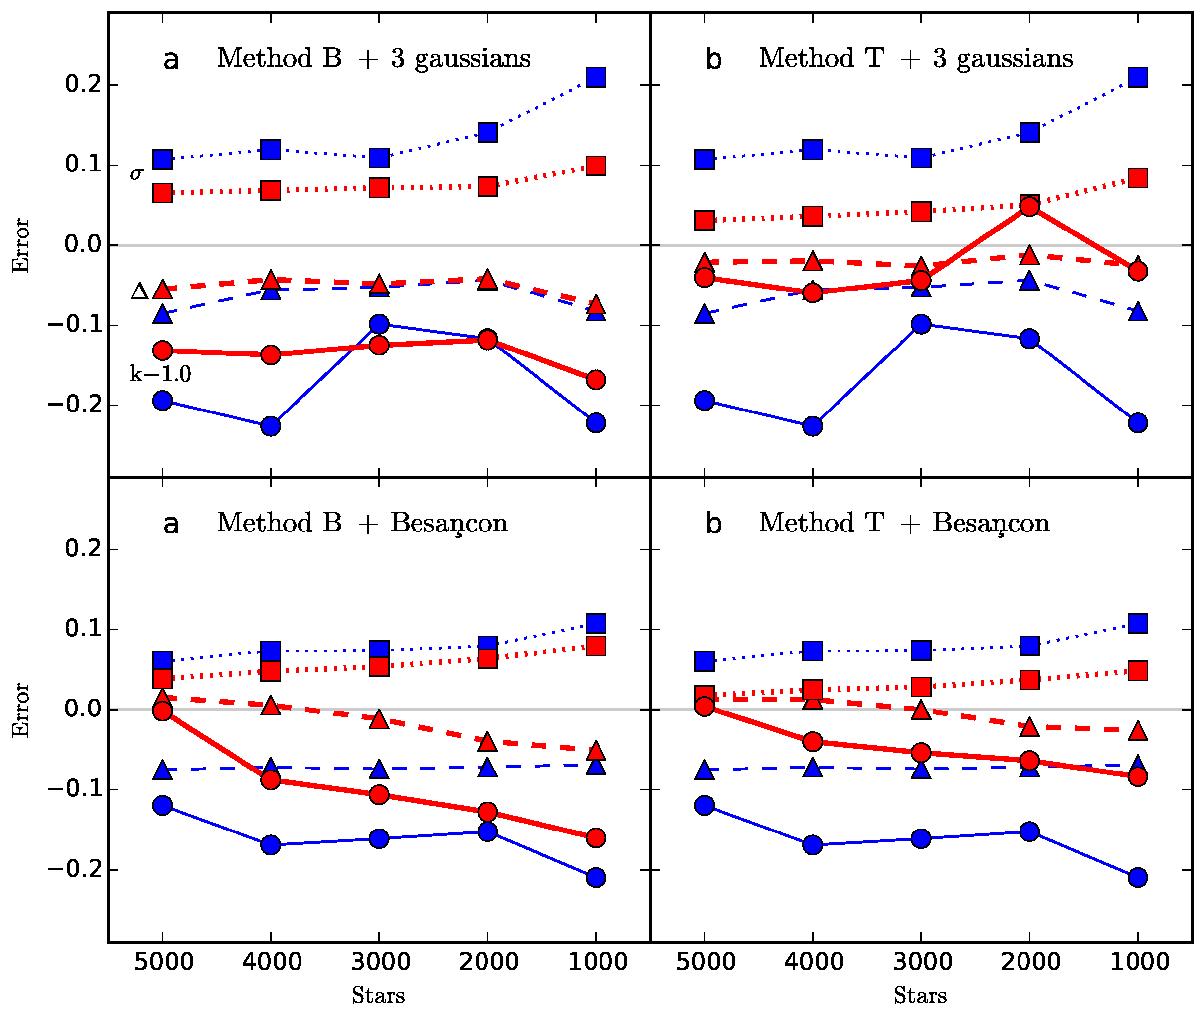
Comparison of rms error σ (squares), bias Δ (triangles), and least squares slopes k (circles; error is k−1.0) for NICER (blue symbols and lines) and SCEX (red symbols and thick lines) as a function of stellar density. Each decrease of 1000 stars per map also corresponds to an increase of 1.0 mag in the limiting magnitude.
Current usage metrics show cumulative count of Article Views (full-text article views including HTML views, PDF and ePub downloads, according to the available data) and Abstracts Views on Vision4Press platform.
Data correspond to usage on the plateform after 2015. The current usage metrics is available 48-96 hours after online publication and is updated daily on week days.
Initial download of the metrics may take a while.