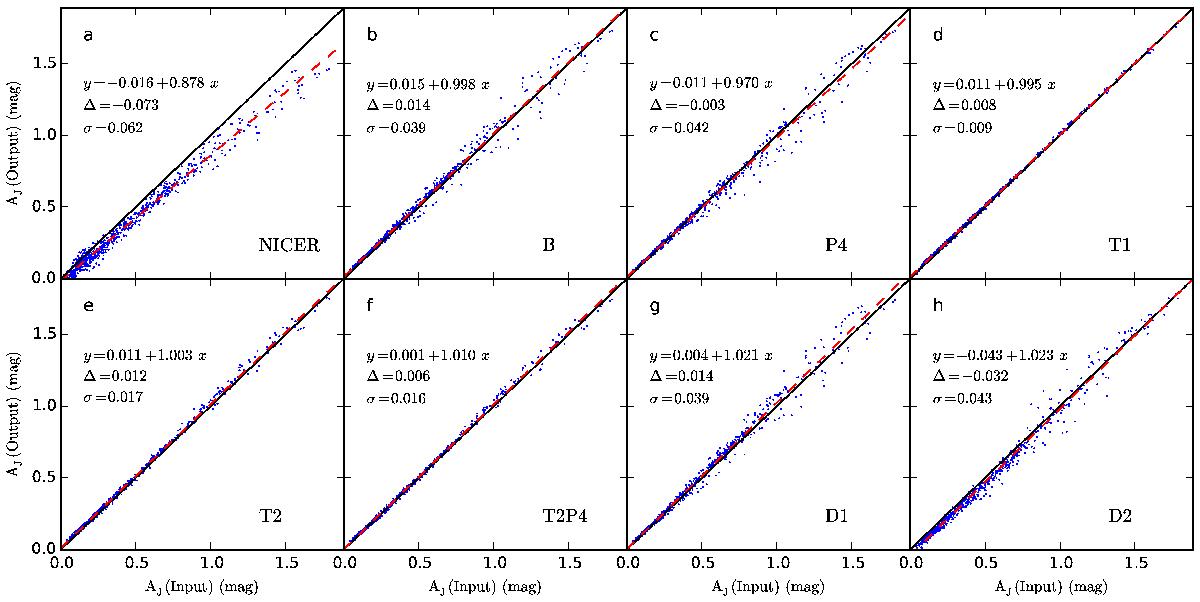
Fig. 12

Correlations between estimated and true extinction in tests with stars simulated with the Besançon model. Results are shown for NICER (frame a)), Method B (frame b)), Method B with separate reference colours for four magnitude intervals (frame c)), Method T using a perfect extinction template (frame d)), or using the NICER map as the template with a single (frame e)) or four reference colours (frame f)). The final frames include bias correction with methods D1 and D2 (frames g) and h), respectively). Each frame lists the parameters of linear least squares, the bias Δ, and the rms error σ.
Current usage metrics show cumulative count of Article Views (full-text article views including HTML views, PDF and ePub downloads, according to the available data) and Abstracts Views on Vision4Press platform.
Data correspond to usage on the plateform after 2015. The current usage metrics is available 48-96 hours after online publication and is updated daily on week days.
Initial download of the metrics may take a while.


