Fig. 1
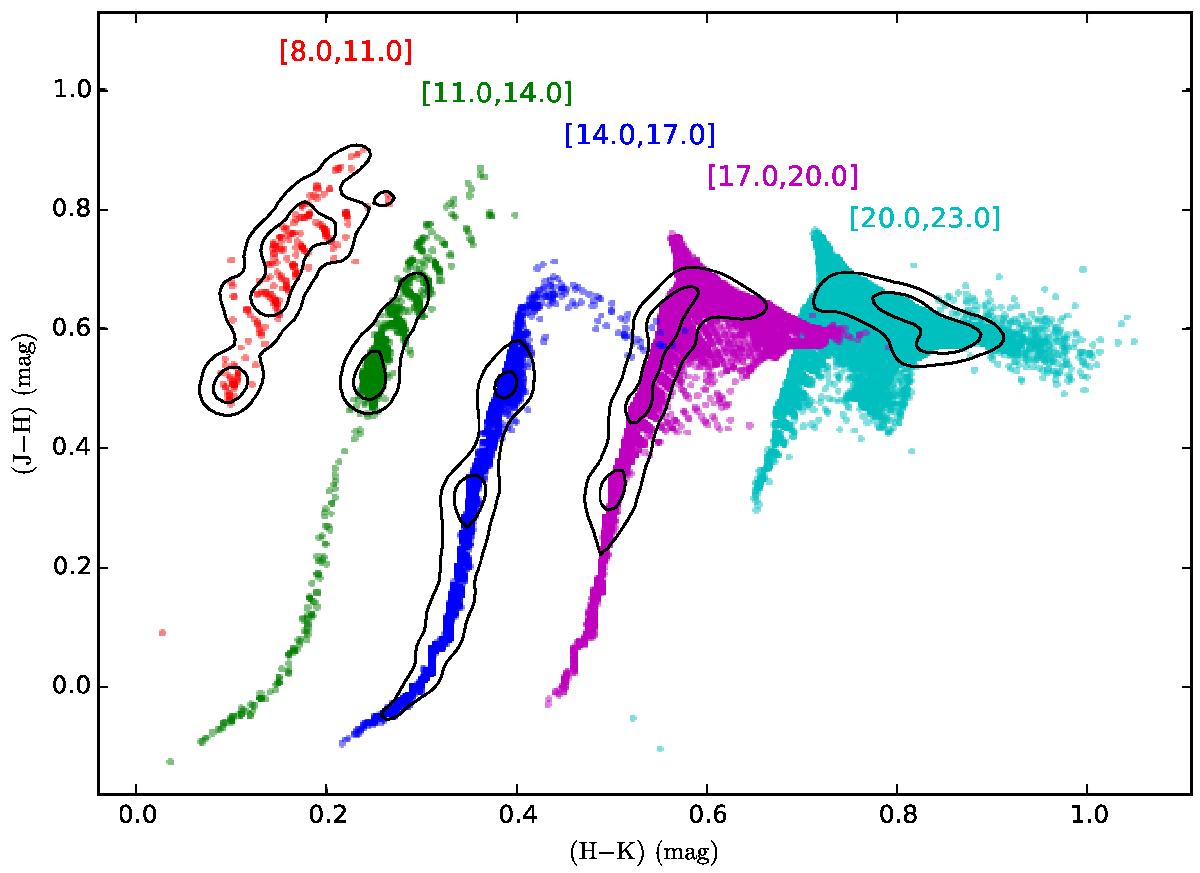
Stellar colours for Galactic direction (l, b) = (10°, 20°) for a sample of stars simulated from the Besançon model (Robin et al. 2014). The different intervals of J-band magnitude are plotted in different colours, as indicated by the values in the upper part of the figure. After the first one (8.0–11.0 mag), the subsequent sets of points are shifted by Δ(H−K) = 0.15 mag, for better readability. The smoothed contours are drawn at 10% and 50% of the maximum star density.
Current usage metrics show cumulative count of Article Views (full-text article views including HTML views, PDF and ePub downloads, according to the available data) and Abstracts Views on Vision4Press platform.
Data correspond to usage on the plateform after 2015. The current usage metrics is available 48-96 hours after online publication and is updated daily on week days.
Initial download of the metrics may take a while.