Fig. 3
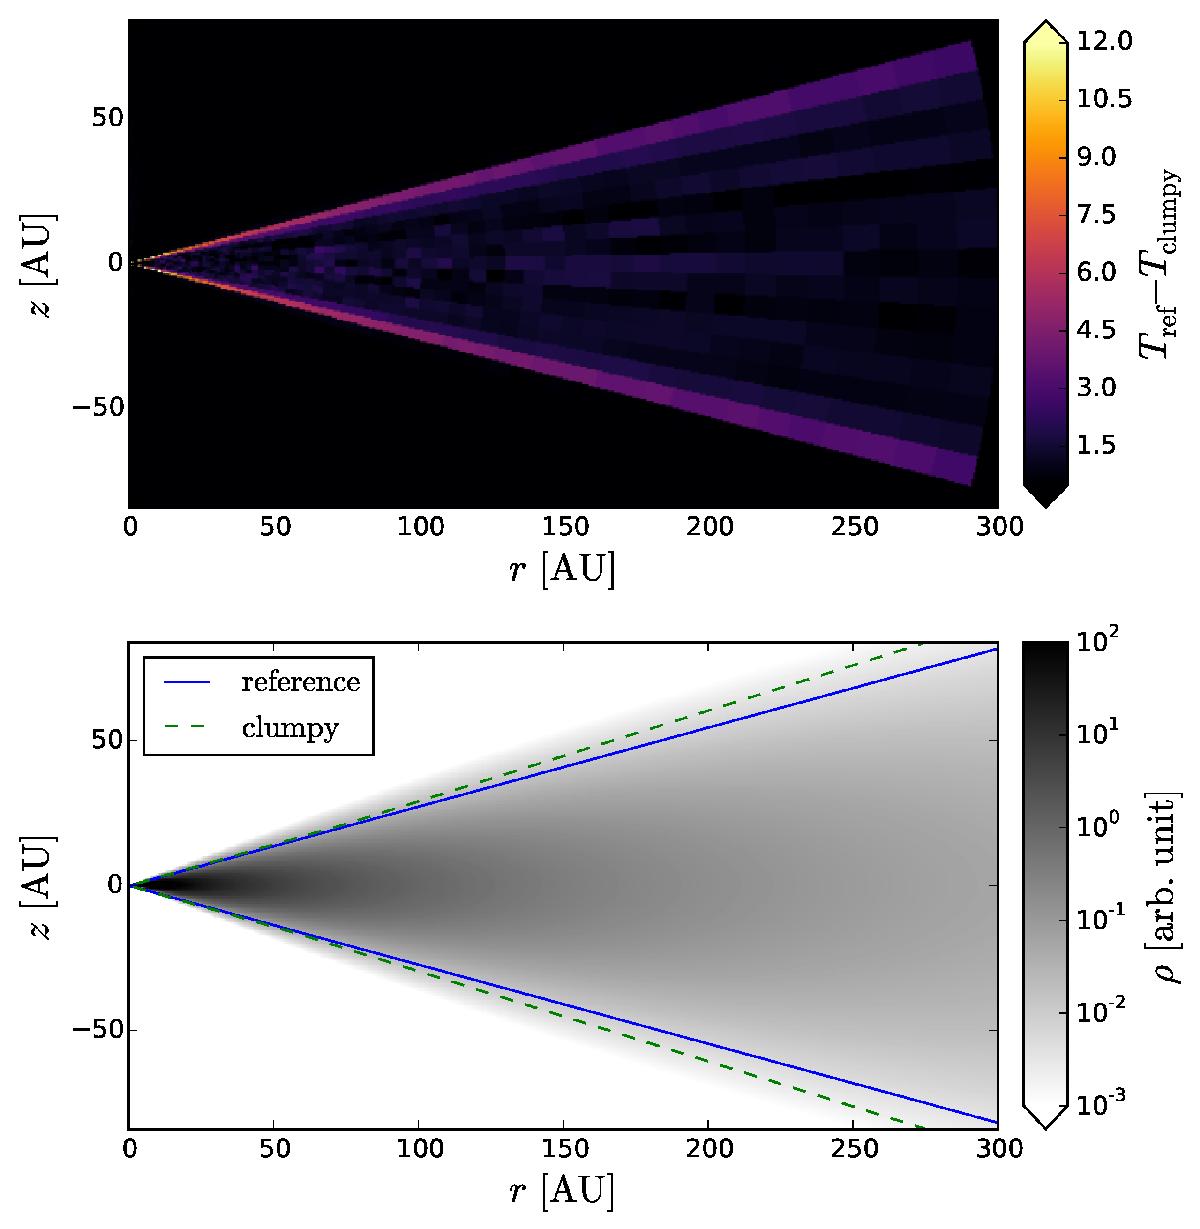
Temperature difference between the reference disk and a selected clumpy disk (top) and lines with optical depth τ ~ 1 of our reference disk and the clumpy disk (bottom). The density distribution in the bottom image is taken from Eq. (1). The optical depth is calculated at the wavelength of maximum stellar emissivity in the way of the stellar radiation. (η = 0.3, k = 32, i = 0°, Mdust = 10-6M⊙, amin = 0.005 μm and amax = 0.25 μm.)
Current usage metrics show cumulative count of Article Views (full-text article views including HTML views, PDF and ePub downloads, according to the available data) and Abstracts Views on Vision4Press platform.
Data correspond to usage on the plateform after 2015. The current usage metrics is available 48-96 hours after online publication and is updated daily on week days.
Initial download of the metrics may take a while.