Fig. 10
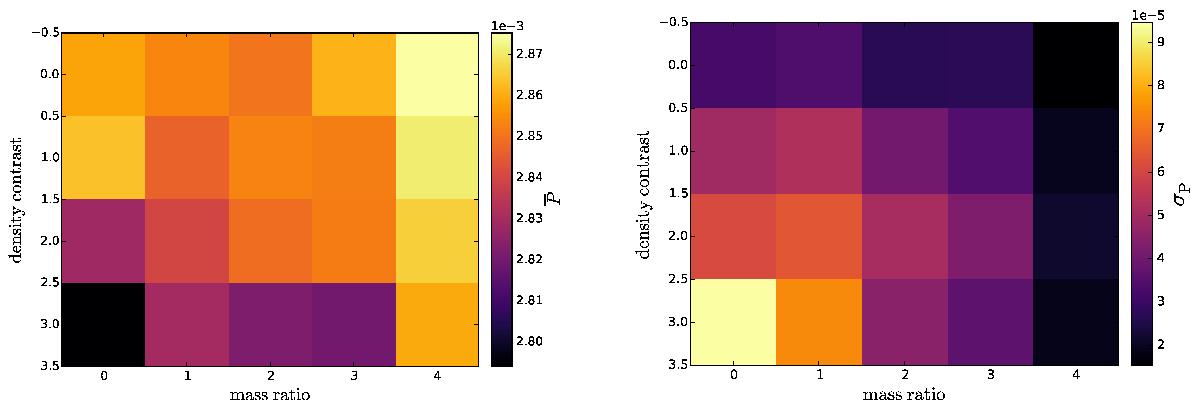
Mean degree of polarization (left) and its standard deviation (right) dependent on mass ratio and density contrast. Each configuration is simulated with 100 different positions of clumps. (λ = 0.726 μm, i = 45°, Mdust = 10-6M⊙, amin = 0.005 μm and amax = 0.25 μm)
This figure is made of several images, please see below:
Current usage metrics show cumulative count of Article Views (full-text article views including HTML views, PDF and ePub downloads, according to the available data) and Abstracts Views on Vision4Press platform.
Data correspond to usage on the plateform after 2015. The current usage metrics is available 48-96 hours after online publication and is updated daily on week days.
Initial download of the metrics may take a while.