Fig. 1
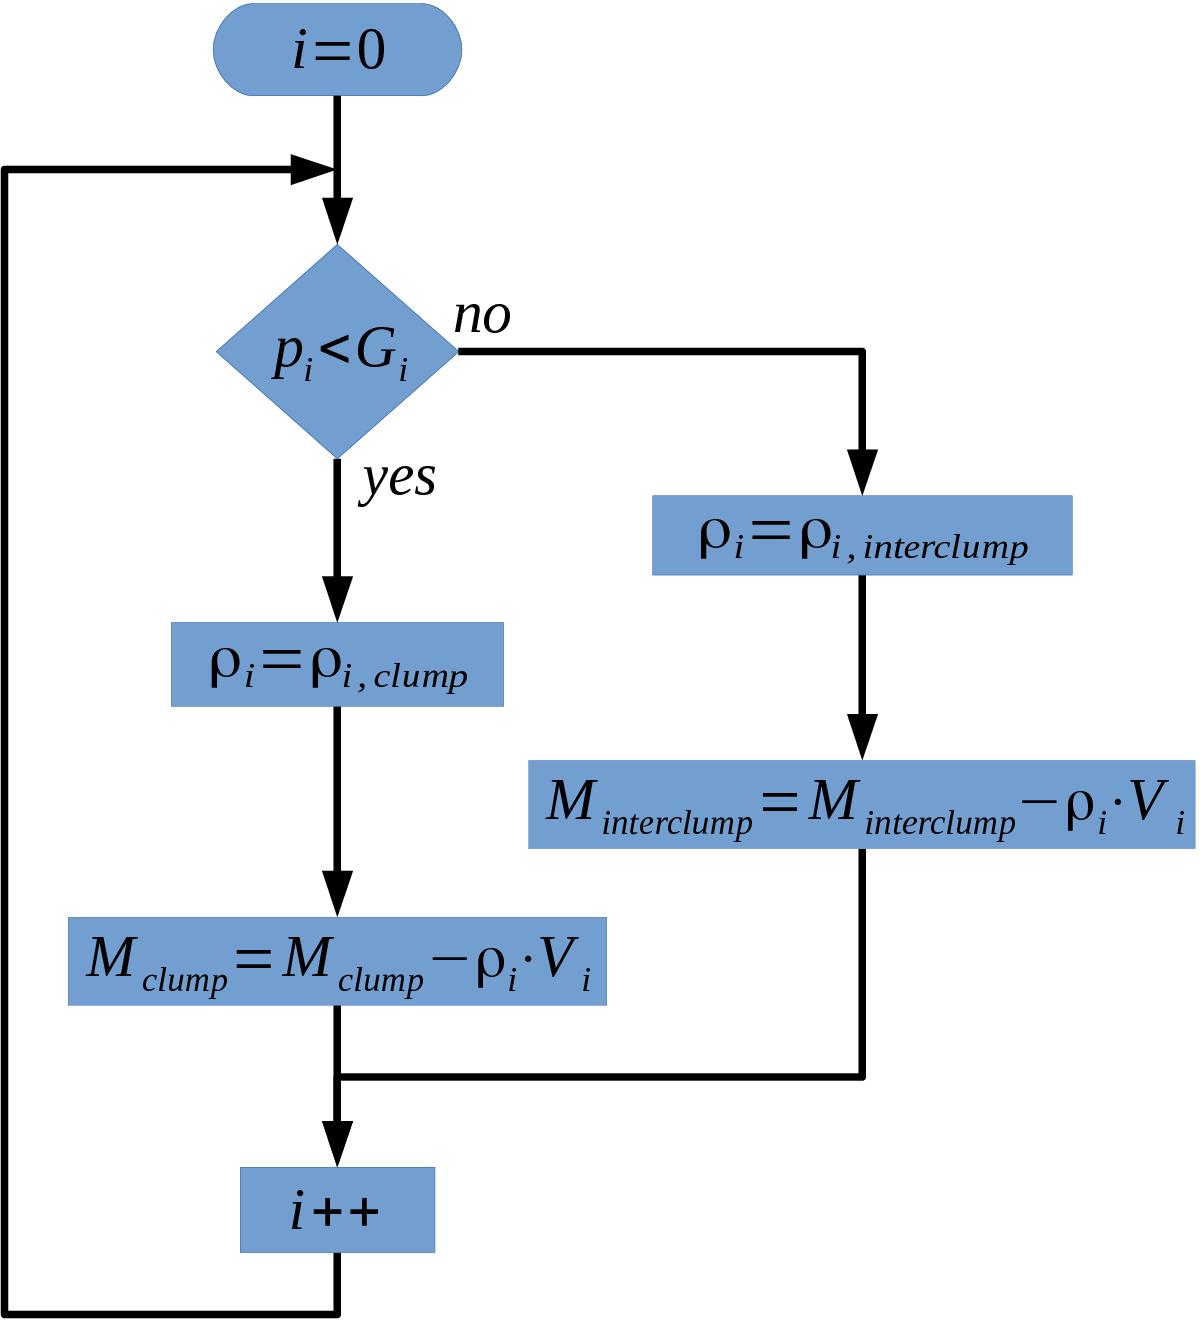
Flowchart of the clump distribution algorithm. The quantity i is the index number of a cell, while Vi is the related cell volume. The quantity Gi describes the threshold which defines the probability that a cell represents the clump phase. The quantities ρi,clump and ρi,interclump describe the density of cell i, if it would be in the corresponding phase.
Current usage metrics show cumulative count of Article Views (full-text article views including HTML views, PDF and ePub downloads, according to the available data) and Abstracts Views on Vision4Press platform.
Data correspond to usage on the plateform after 2015. The current usage metrics is available 48-96 hours after online publication and is updated daily on week days.
Initial download of the metrics may take a while.