Free Access
Fig. 3
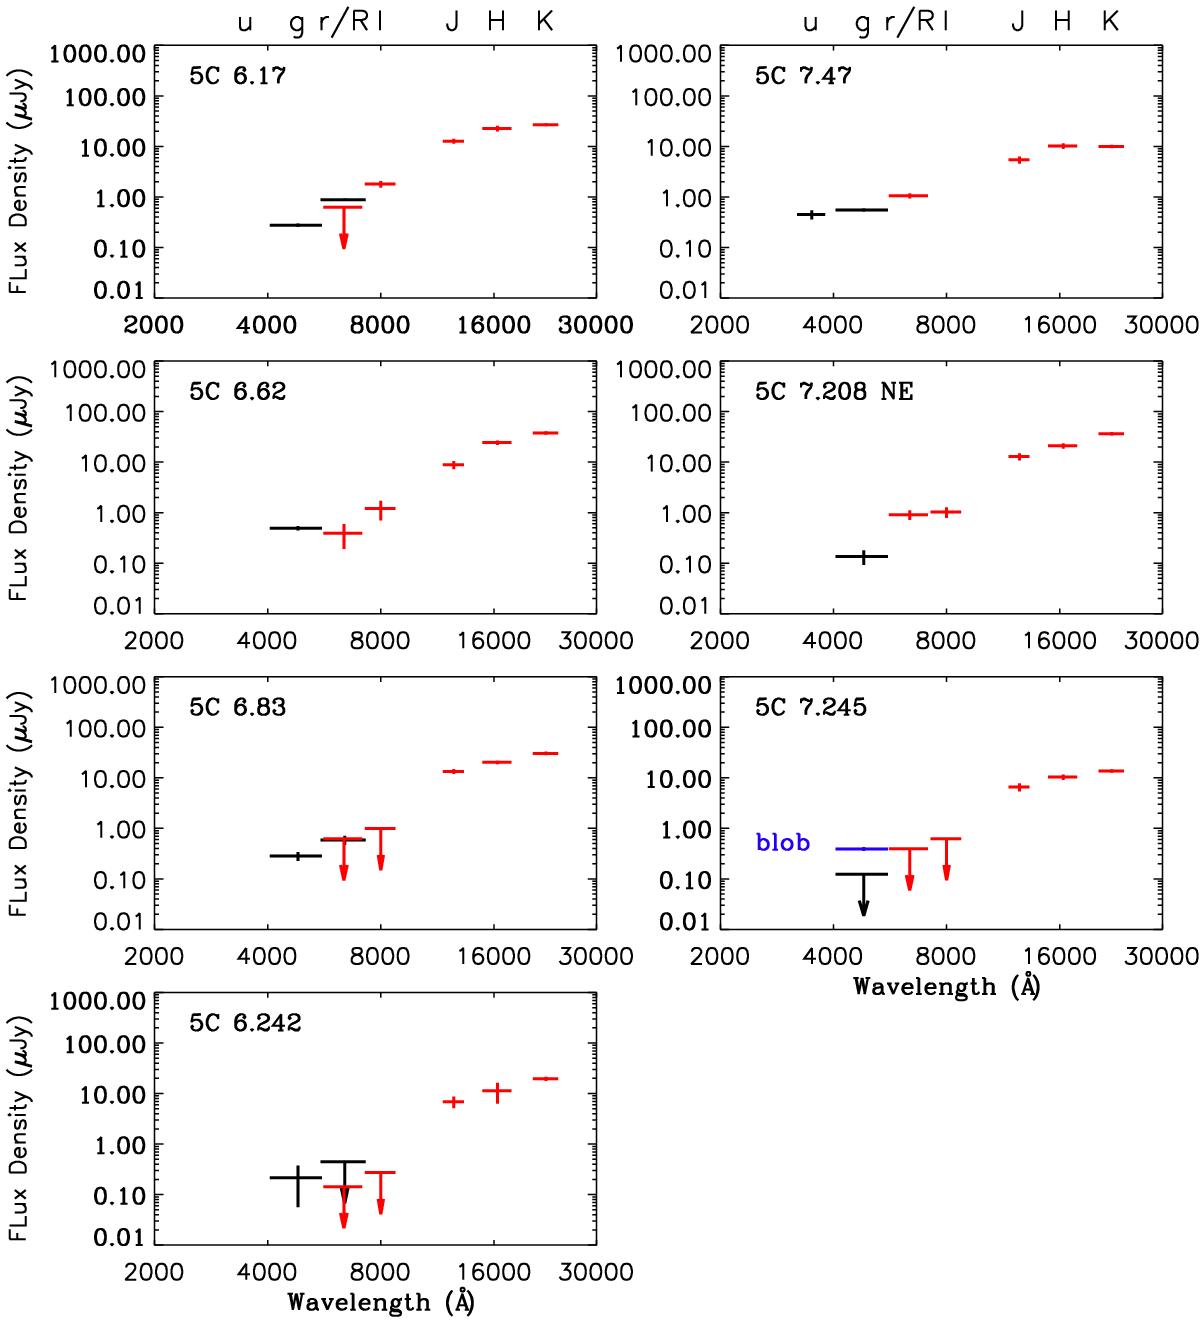
Broad-band spectral energy distributions of the radio galaxies, showing our new photometry (black) and the photometry of Willott et al. (2001; red). For 5C 7.245, we also show the g-band photometry of the extended blob of emission located ~1′′ SW of the near-infrared position of the radio galaxy (blue).
Current usage metrics show cumulative count of Article Views (full-text article views including HTML views, PDF and ePub downloads, according to the available data) and Abstracts Views on Vision4Press platform.
Data correspond to usage on the plateform after 2015. The current usage metrics is available 48-96 hours after online publication and is updated daily on week days.
Initial download of the metrics may take a while.