Fig. 2
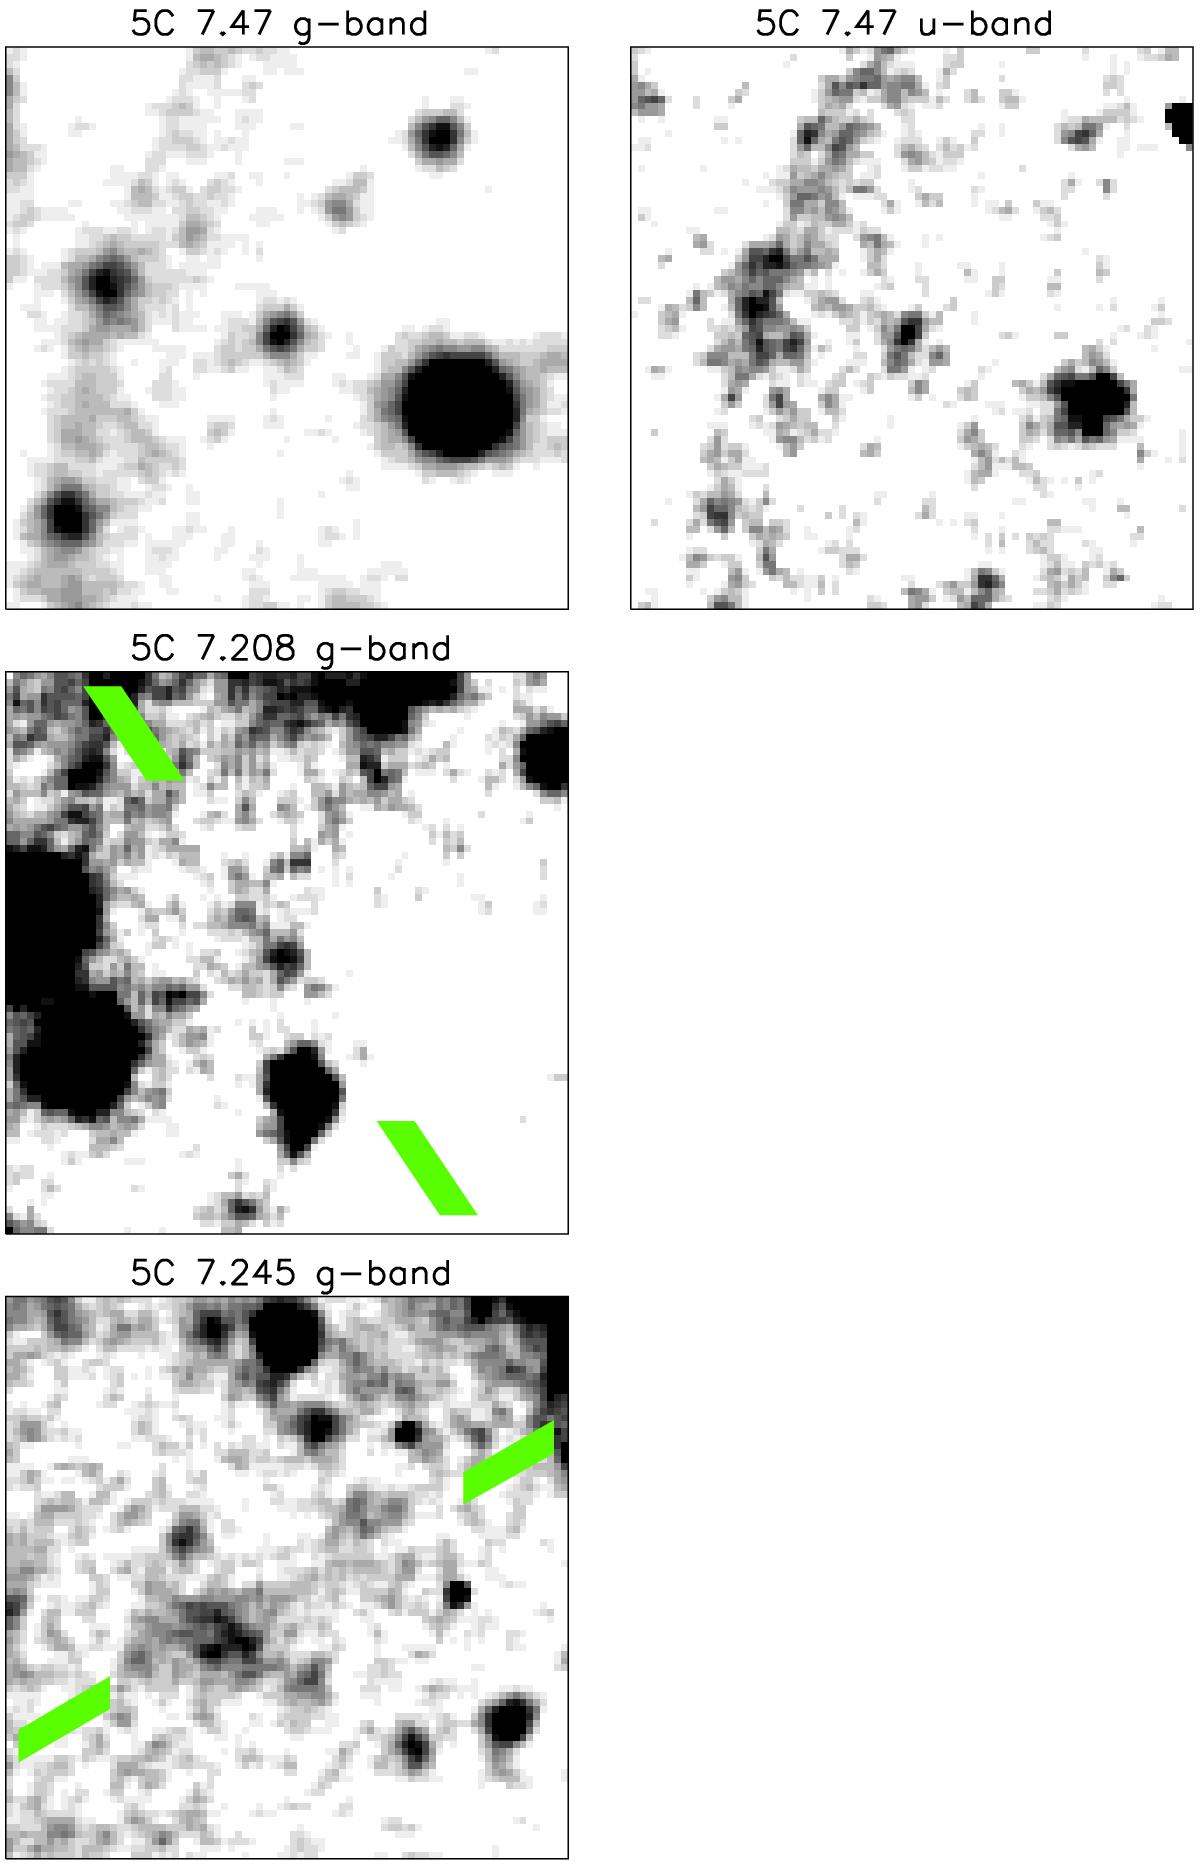
Cut-outs from the g- and u-band images of the 7C-II radio galaxies, showing 20′′ × 20′′ centred on the position of the radio galaxy. Green bars show the position angle of the radio emission. The images have been smoothed using a 3-pixel boxcar average. The image of 5C 7.208 is centred on the southern emission component (5C 7.208 S). The images of 5C 7.47 show ghost-arcs that are due to a bright star positioned elsewhere on the detector array.
Current usage metrics show cumulative count of Article Views (full-text article views including HTML views, PDF and ePub downloads, according to the available data) and Abstracts Views on Vision4Press platform.
Data correspond to usage on the plateform after 2015. The current usage metrics is available 48-96 hours after online publication and is updated daily on week days.
Initial download of the metrics may take a while.