Fig. 7
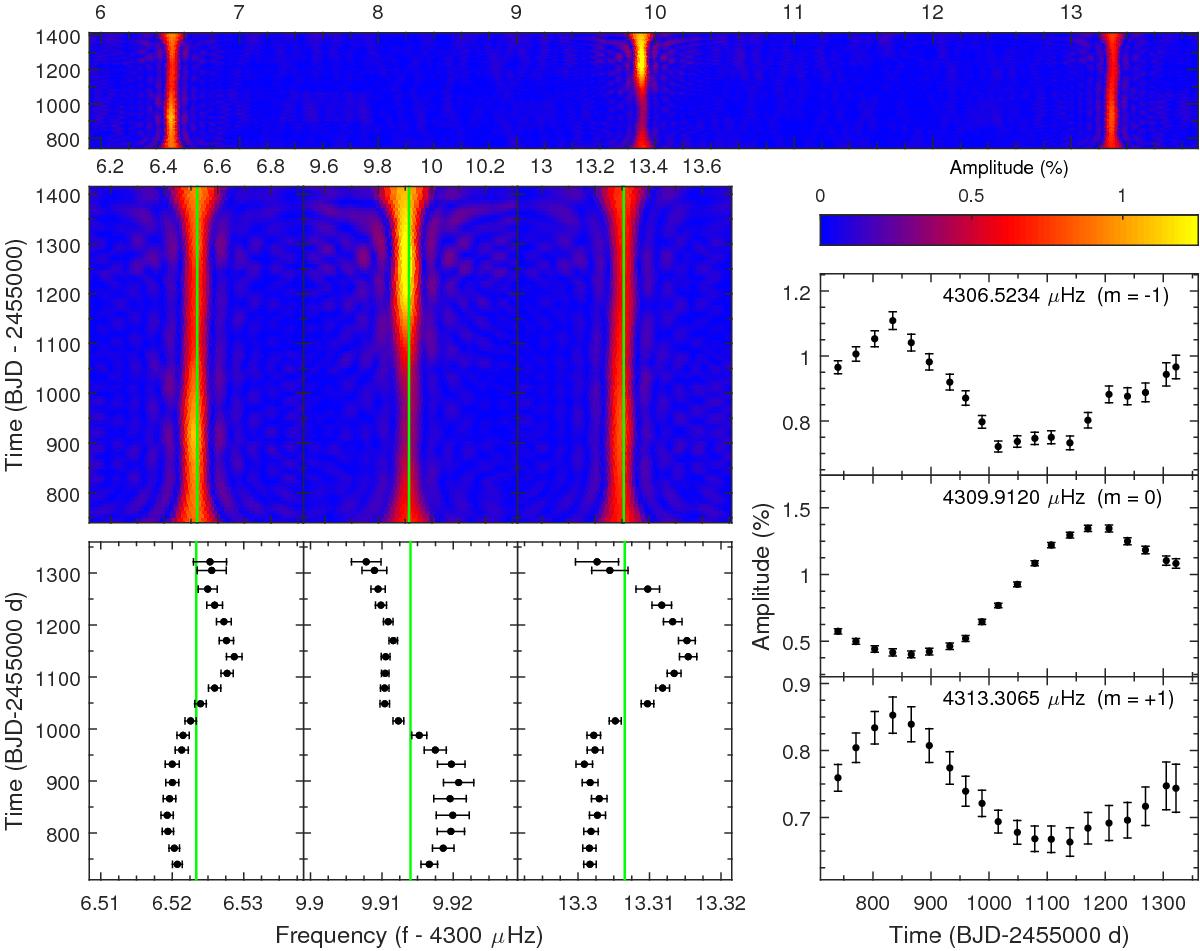
Frequency and amplitude modulations in the f1 triplet at 4310 μHz. The top panel shows the sLSP (giving the amplitude in % as a function of frequency in μHz and time in days) of the triplet as a whole. The middle and bottom left panels show increasingly expanded views around the average frequency (the solid vertical lines) of each component, with the bottom left panel obtained from prewhitening subsets of the data, thus measuring precisely the frequencies, as a function of time. The lower right panel provides the measured amplitudes as a function of time obtained for each subset of data (see text for details).
Current usage metrics show cumulative count of Article Views (full-text article views including HTML views, PDF and ePub downloads, according to the available data) and Abstracts Views on Vision4Press platform.
Data correspond to usage on the plateform after 2015. The current usage metrics is available 48-96 hours after online publication and is updated daily on week days.
Initial download of the metrics may take a while.