Fig. 2
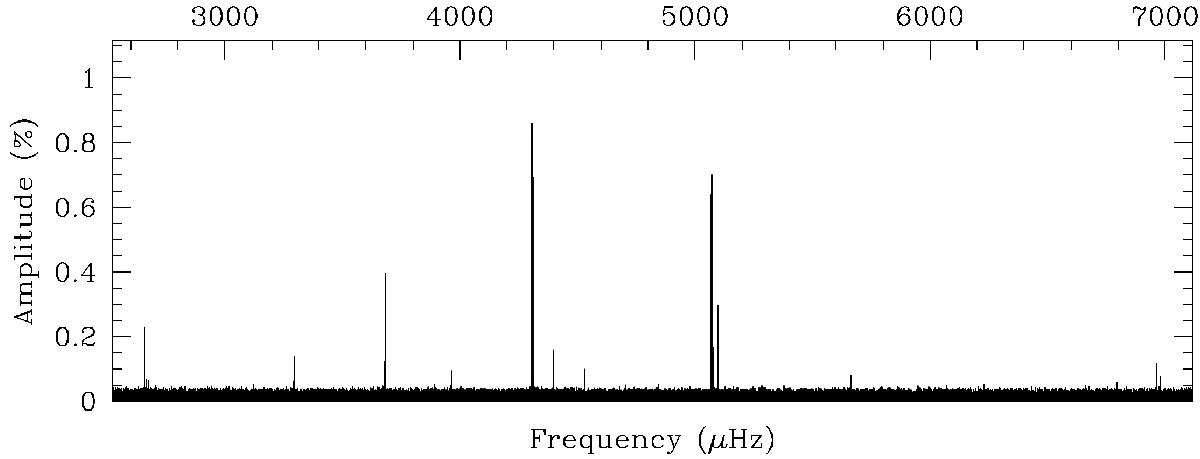
Lomb-Scargle periodogram (LSP; amplitude in % of the mean brightness vs. frequency in μHz) of the Kepler light curve. The represented range covers the frequency region where the pulsation modes are detected (no significant signal is found outside these limits). Note that some well known Kepler instrumental artefacts are within this frequency range but can easily be recognized.
Current usage metrics show cumulative count of Article Views (full-text article views including HTML views, PDF and ePub downloads, according to the available data) and Abstracts Views on Vision4Press platform.
Data correspond to usage on the plateform after 2015. The current usage metrics is available 48-96 hours after online publication and is updated daily on week days.
Initial download of the metrics may take a while.