Fig. 13
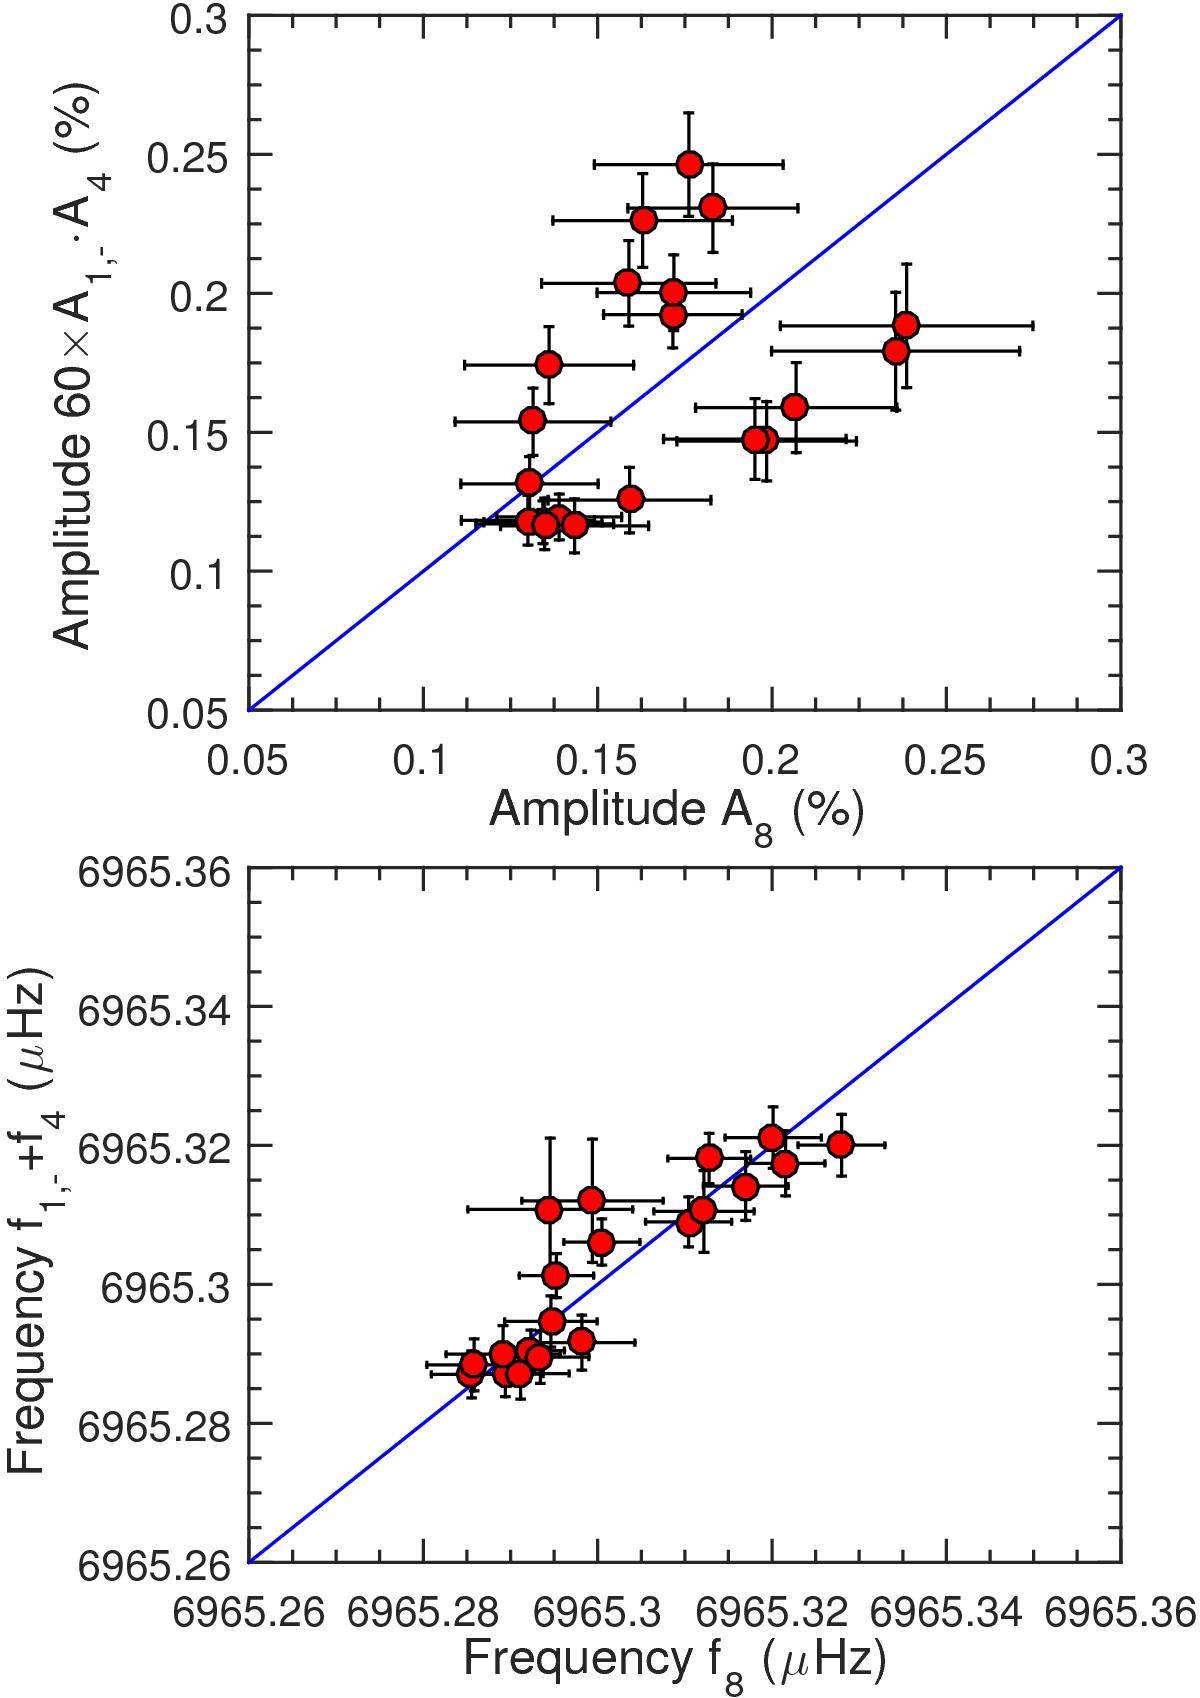
Top panel: comparison between the measured amplitude A8 of f8 and 60 × A1, −·A4 (where A1, − and A4 are the amplitudes of f1, − and f4, respectively) at each time segment (see text). Bottom panel: same as top panel but for a comparison between the measured frequency f8 and sum of the frequencies f1, − + f4. In both cases, the relationship is exactly statisfied along the plain diagonal line. All the measurements are found to be within 2σ of this line.
Current usage metrics show cumulative count of Article Views (full-text article views including HTML views, PDF and ePub downloads, according to the available data) and Abstracts Views on Vision4Press platform.
Data correspond to usage on the plateform after 2015. The current usage metrics is available 48-96 hours after online publication and is updated daily on week days.
Initial download of the metrics may take a while.