Free Access
Fig. 12
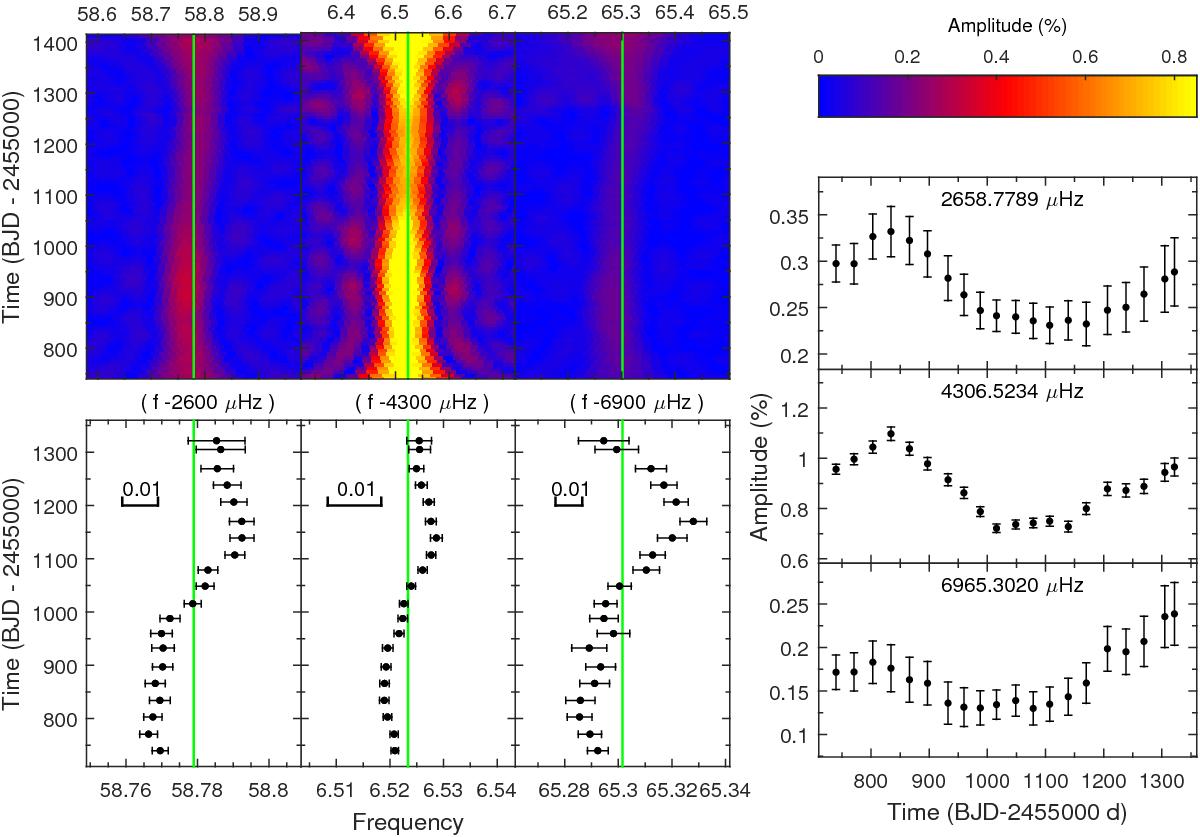
Frequency and amplitude modulations of the components that form the linear combination f1, − + f4 = f8. The panels are similar to those described in Fig. 7. The three components show clear periodic modulations evolving in phase. In each bottom left subpanels, a segment indicates the 0.01 μHz scale.
Current usage metrics show cumulative count of Article Views (full-text article views including HTML views, PDF and ePub downloads, according to the available data) and Abstracts Views on Vision4Press platform.
Data correspond to usage on the plateform after 2015. The current usage metrics is available 48-96 hours after online publication and is updated daily on week days.
Initial download of the metrics may take a while.