Fig. 9
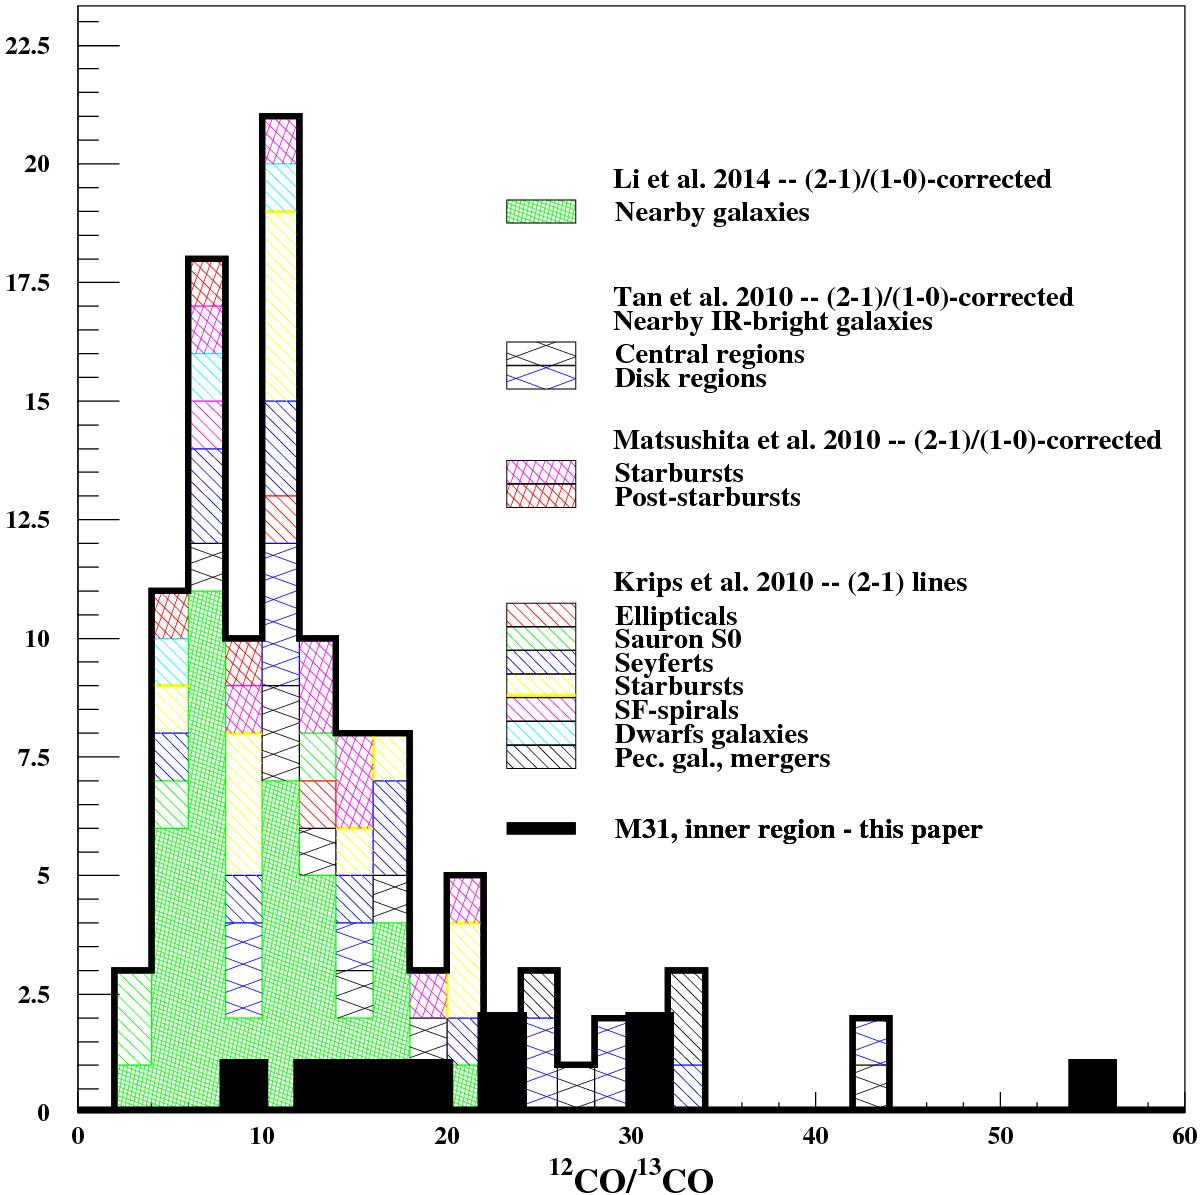
Comparison of our 12CO/13CO line ratio with previous measurements in nearby galaxies. The hatched histogram displayed the 12CO/13CO line ratios with available morphological types. The Li et al. (2011), Matsushita et al. (2010) and Tan et al. (2011) samples measured the (1–0) transition and have been corrected by a factor 1.33 as discussed in the text. The Krips et al. (2010) sample and our measurements were directly measured the (2–1) transition. The black full line histogram gathers all the four samples corrected to (2–1). The black thick line histogram in the bottom corresponds to the measurements performed in this paper. The average 12CO/13CO detected in this paper tends to be a bit larger than the main distribution from other areas and other galaxies (but well below the standard isotopic ratio of 53Wilson & Rood 1994). The largest value above 50 might corresponds to an optically thin cloud, but it is affected by a large error bar (30%, see Table A.1).
Current usage metrics show cumulative count of Article Views (full-text article views including HTML views, PDF and ePub downloads, according to the available data) and Abstracts Views on Vision4Press platform.
Data correspond to usage on the plateform after 2015. The current usage metrics is available 48-96 hours after online publication and is updated daily on week days.
Initial download of the metrics may take a while.