Fig. 7
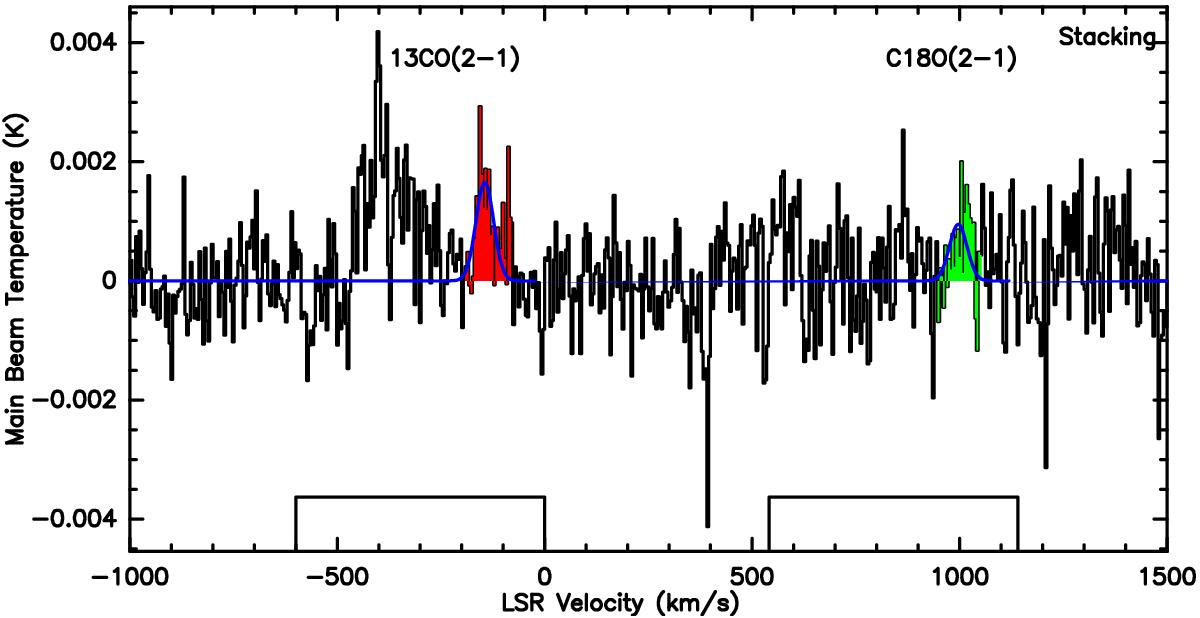
Stacking centred at − 144.3 km s-1 of each 13CO(2–1) velocity component with v> −300 km s-1. The 13CO component is displayed in red (at − 144 km s-1). There is a component (displayed in green at − 1285 km s-1) in C18O which appears at the same velocity. The lines adjustment are displayed in blue. The velocity ranges corresponding to the two lines are displayed as rectangles. Standard weights (∝ Tintδv/Tsys2) for each observation have been used for the averaging.
Current usage metrics show cumulative count of Article Views (full-text article views including HTML views, PDF and ePub downloads, according to the available data) and Abstracts Views on Vision4Press platform.
Data correspond to usage on the plateform after 2015. The current usage metrics is available 48-96 hours after online publication and is updated daily on week days.
Initial download of the metrics may take a while.