Free Access
Fig. 6
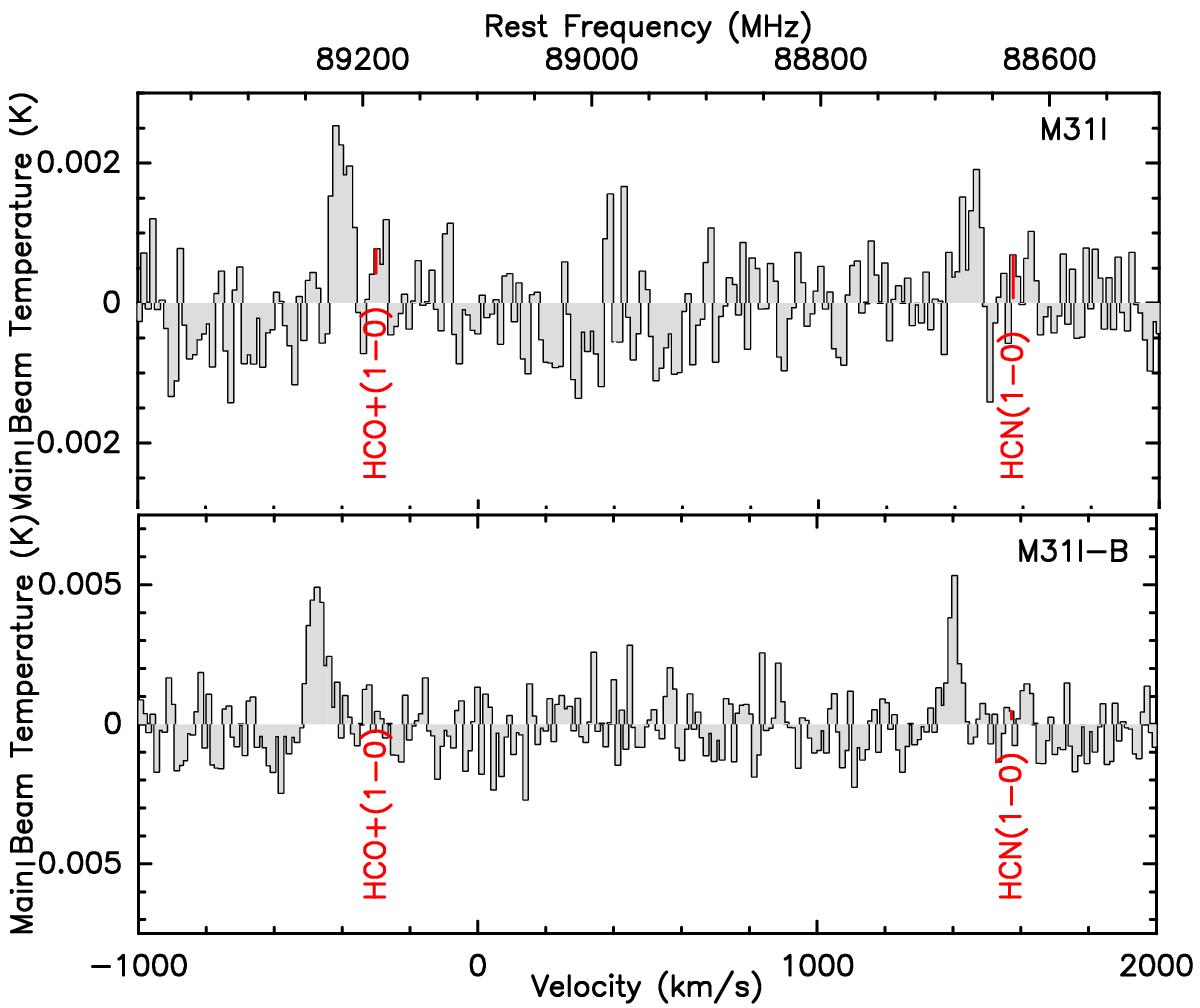
Signal detected in HCO+(1–0) and HCN(1–0) at the position of M31I (top) and M31I-B (bottom). The main-beam temperatures are displayed as a function of the rest-frame frequency of the Andromeda galaxy (corresponding to − 300 km s-1).
This figure is made of several images, please see below:
Current usage metrics show cumulative count of Article Views (full-text article views including HTML views, PDF and ePub downloads, according to the available data) and Abstracts Views on Vision4Press platform.
Data correspond to usage on the plateform after 2015. The current usage metrics is available 48-96 hours after online publication and is updated daily on week days.
Initial download of the metrics may take a while.