Free Access
Fig. A.4
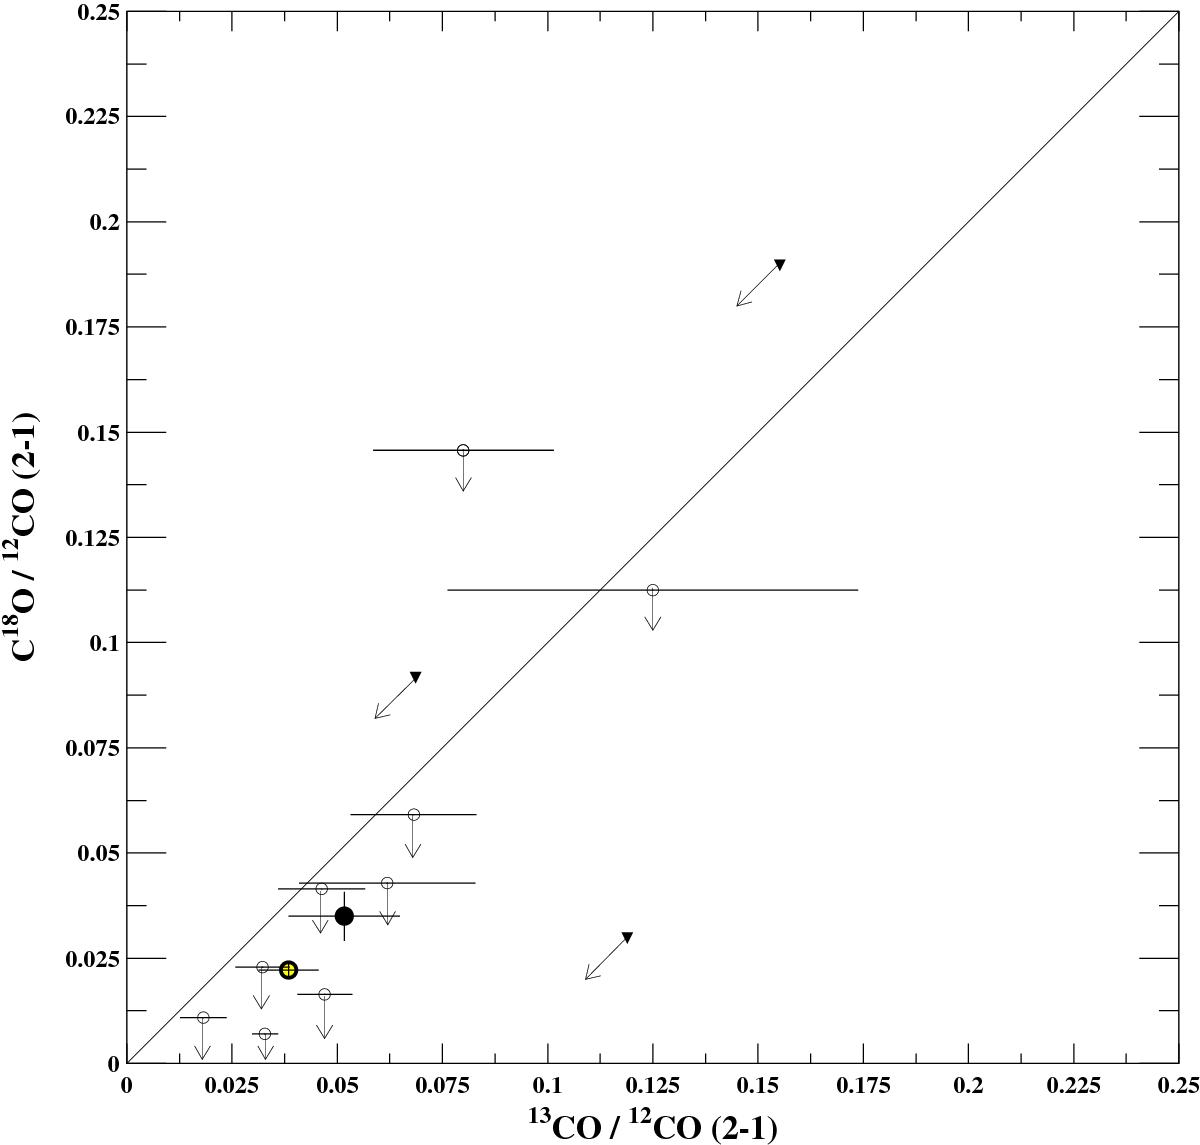
C18O/12CO (2–1) line ratios versus the 13CO/12CO(2–1) line ratios presented in this paper. Arrows indicated 3σ upper limits. The full black (empty yellow) point with error bars corresponds to our direct detection (our red stack detection). The line indicates a slope 1.
Current usage metrics show cumulative count of Article Views (full-text article views including HTML views, PDF and ePub downloads, according to the available data) and Abstracts Views on Vision4Press platform.
Data correspond to usage on the plateform after 2015. The current usage metrics is available 48-96 hours after online publication and is updated daily on week days.
Initial download of the metrics may take a while.