Free Access
Fig. A.2
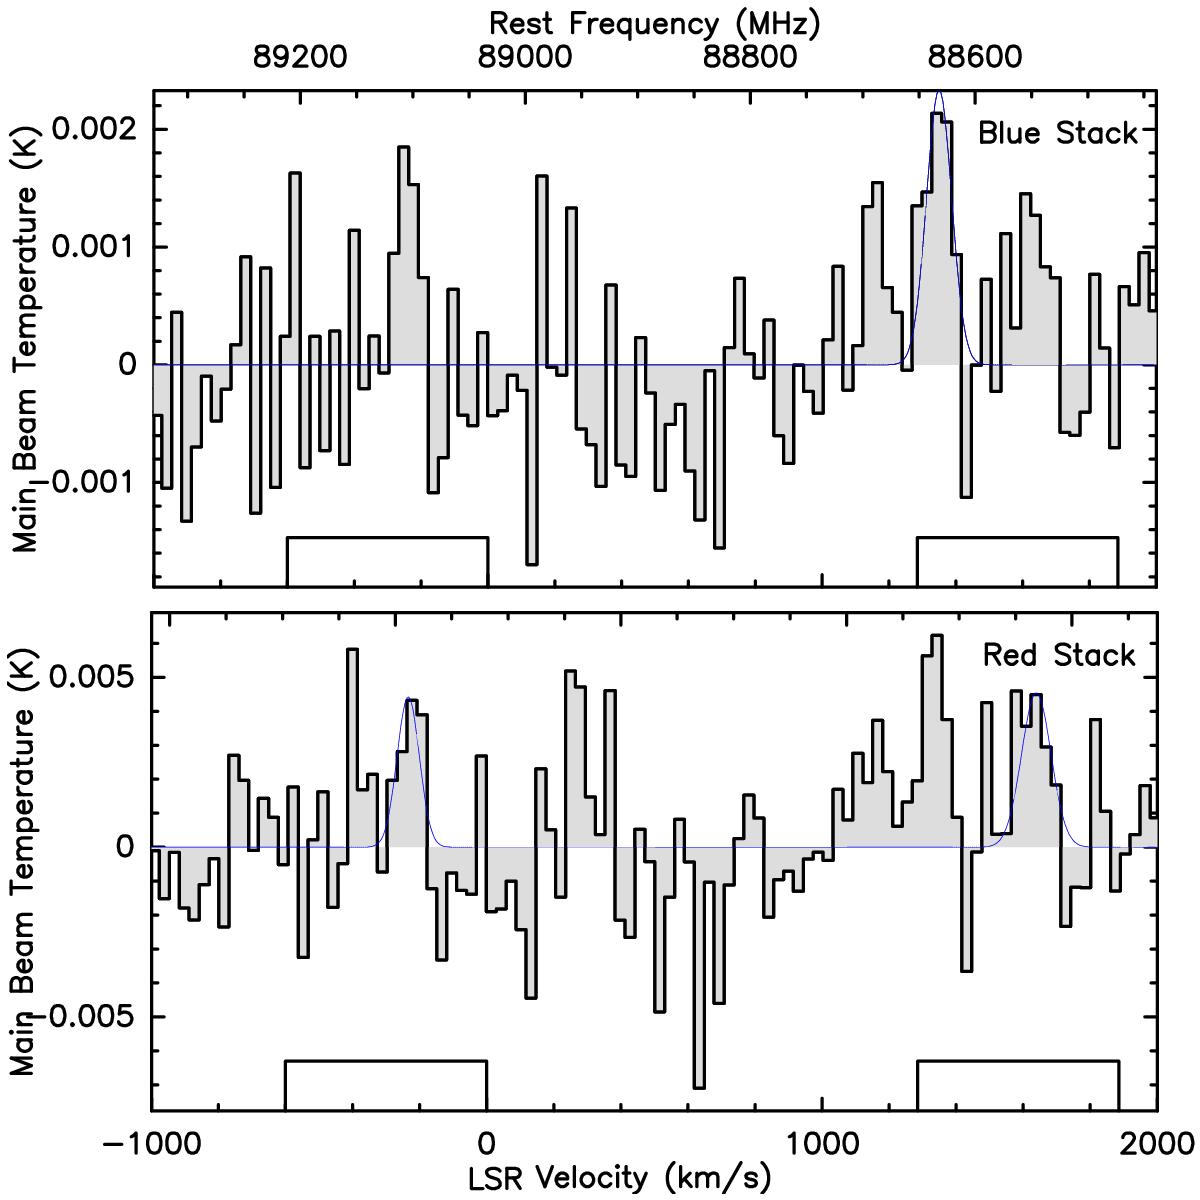
HCN(1–0) and HCO+(1–0) stacking of the south-east positions. The stacking is based on the 13CO velocities. The top (bottom) panel shows the stacking corresponding to >–300 km s-1 (<–300 km s-1) velocities. The velocities are shown in the rest-frame frequency of the HCO+(1–0) line.
Current usage metrics show cumulative count of Article Views (full-text article views including HTML views, PDF and ePub downloads, according to the available data) and Abstracts Views on Vision4Press platform.
Data correspond to usage on the plateform after 2015. The current usage metrics is available 48-96 hours after online publication and is updated daily on week days.
Initial download of the metrics may take a while.