Fig. 14
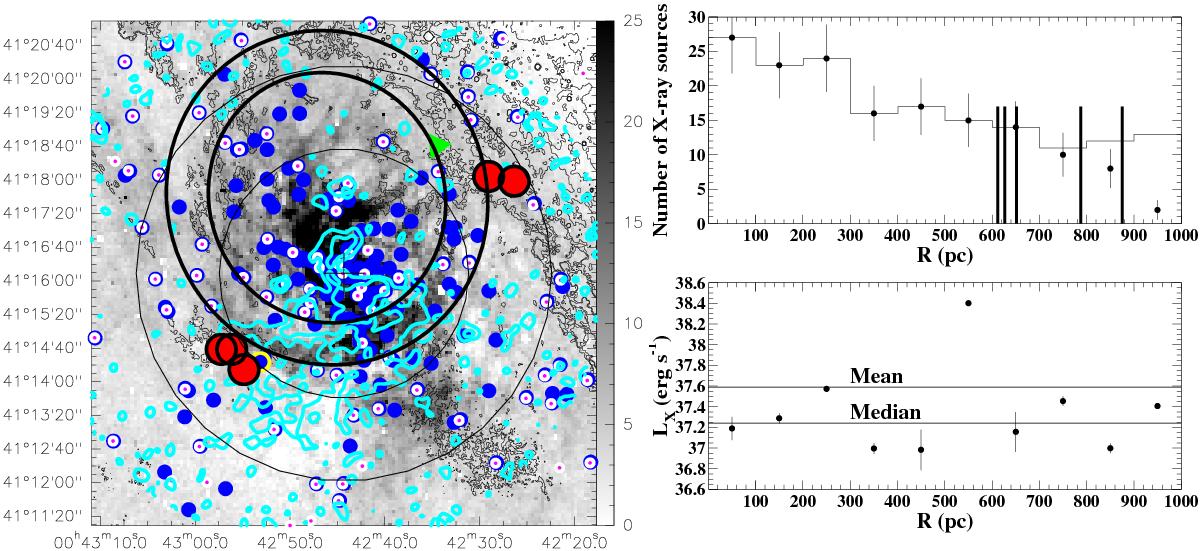
Known heating sources. On the left side, we superimpose on the Hα+[NII] map from Ciardullo et al. (1988): the X-ray sources detected by Hofmann et al. (2013) with blue dots; the 1 Gyr young stellar cluster detected by Kang et al. (2012) with the green triangle; and the X-ray sources detected by Stiele et al. (2011) and Barnard et al. (2014) with white and purple dots. The blue dots with a yellow circle correspond to the first (and more central) ultra-luminous X-ray transient (ULX) detected in M31 (e.g. Kaur et al. 2012). The black contours correspond to the apparent AB extinction map discussed in Melchior et al. (2000). The light blue contours correspond to the 6 cm polarised intensity detected by Gießübel & Beck (2014). The large red circles correspond to our detections. Light black circles provide typical projected radial distance from the centre (x pc and y pc). Thick ellipses show the approximate position of the inner ring. On the right side, we indicate, in the top panel, the number of X-ray sources (Hofmann et al. 2013) detected at each radius; in the bottom panel, the X-ray luminosity at each radius is shown as a function of the radius. The mean and median values of the X-ray luminosity (averaged in 100 pc radial bin) is also provided.
Current usage metrics show cumulative count of Article Views (full-text article views including HTML views, PDF and ePub downloads, according to the available data) and Abstracts Views on Vision4Press platform.
Data correspond to usage on the plateform after 2015. The current usage metrics is available 48-96 hours after online publication and is updated daily on week days.
Initial download of the metrics may take a while.