Fig. 13
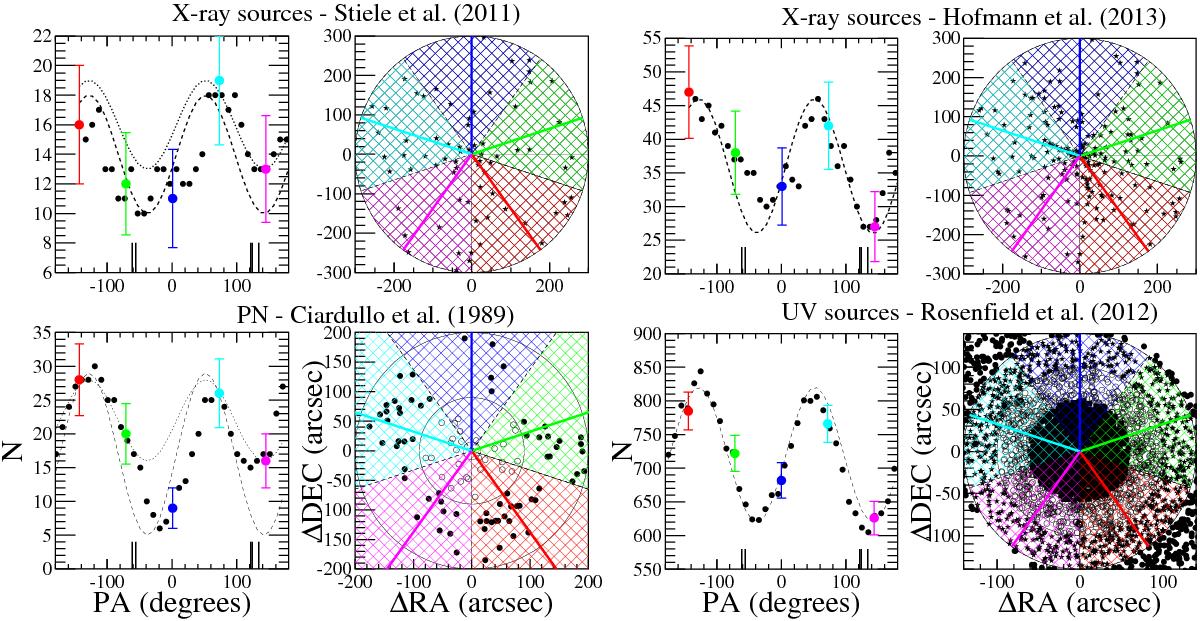
Azimuthal (1st and 3rd columns) and spatial (2nd and 4th) distribution of X-ray sources (top) and planetary nebulae and UV sources (bottom). The top left panels show the deep Chandra-detected X-ray sources from Stiele et al. (2011). The top right panels show the X-ray sources from Hofmann et al. (2013). The bottom left panels indicate the planetary nebulae from Ciardullo et al. (1989; see also Melchior & Combes 2013). The bottom right panels show the HST UV sources from Rosenfield et al. (2012). The dashed line exhibits the best-fit profile from Kaaret (2002) corresponding to a disc with a position angle PA = 52 deg. In the right panels, the two minima are roughly at the same level, while in the left panels the first is deeper as indicated qualitatively with the dotted line. The ticks in the 1st and 3rd figure columns correspond to the position angles of our detections.
Current usage metrics show cumulative count of Article Views (full-text article views including HTML views, PDF and ePub downloads, according to the available data) and Abstracts Views on Vision4Press platform.
Data correspond to usage on the plateform after 2015. The current usage metrics is available 48-96 hours after online publication and is updated daily on week days.
Initial download of the metrics may take a while.