Fig. 12
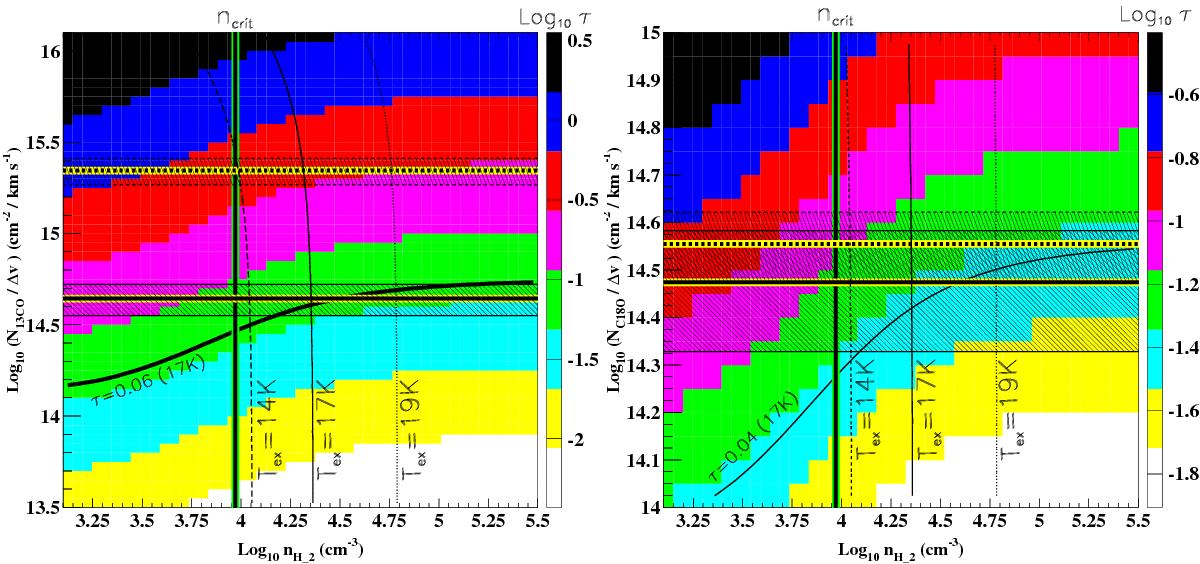
Main physical parameters corresponding to the 13CO(2–1) gas (left panel) and the C18O(2–1) gas (right panel) detected in M31-I(3). The optical depths are shown as function of the 13CO(2–1) column density (per km s-1) and the molecular hydrogen density nH2. The vertical green-black lines indicate the critical densities computed for a collisional temperature of 20 K (see Table 3). The horizontal thick, full yellow-black lines indicate the 13CO(2–1) and the C18O(2–1) averaged column densities (per unit velocity), while the horizontal thin black lines indicate the corresponding 1σ standard deviation; the hatched area corresponds to the M31-I(3) detection. The horizontal thick, dashed yellow-black lines (thin black lines) correspond to the column densities (1σ standard deviation) computed with standard abundances (Bergin et al. 1995) and the corresponding molecular hydrogen column densities. The full line (dashed and dotted) contour levels correspond to an excitation temperature of 17 K (14 K and 19 K). The optical depths, corresponding to 17 K, are shown as a thick line contour level.
Current usage metrics show cumulative count of Article Views (full-text article views including HTML views, PDF and ePub downloads, according to the available data) and Abstracts Views on Vision4Press platform.
Data correspond to usage on the plateform after 2015. The current usage metrics is available 48-96 hours after online publication and is updated daily on week days.
Initial download of the metrics may take a while.