Fig. 11
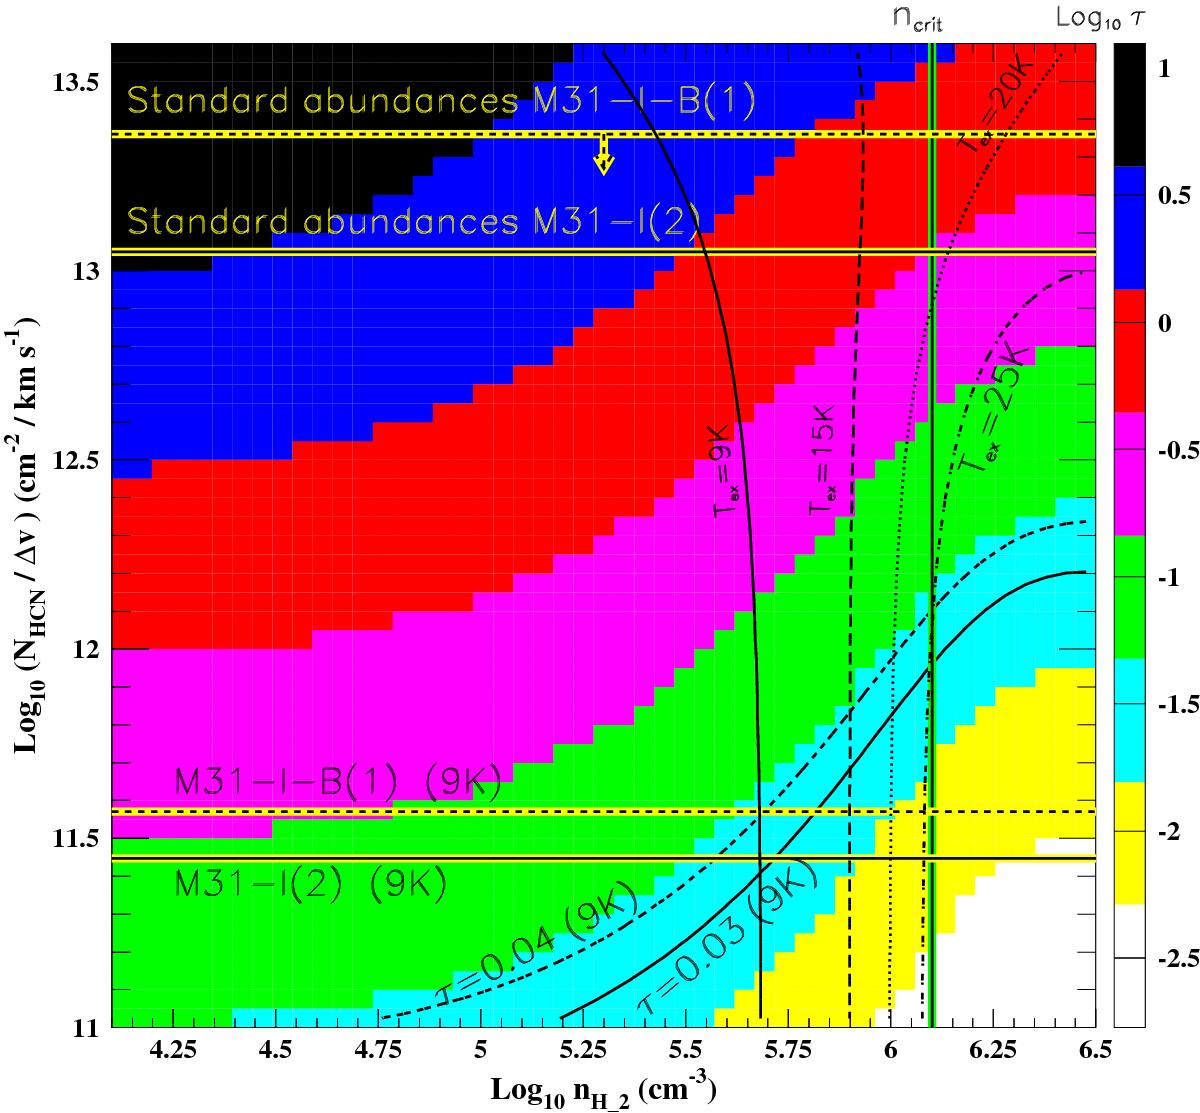
Main physical parameters corresponding to the HCN gas observed in M31-I(2) and M31-I-B(1). The optical depths are shown as function of the HCN column density (per km s-1) and the molecular hydrogen density nH2. The corresponding contours for these two clumps are shown with a dashed line for M31-I-B(1) and with a full line for M31-I(2). The vertical (green) line indicates the critical density computed for a collisional temperature of 20 K (see Table 3). The lower horizontal full (dashed) line shows the column density measured for M31-I(2) (M31-I-B(1)) at 9 K. The upper horizontal lines correspond to the column densities computed with standard abundances (Bergin et al. 1995) and the corresponding molecular hydrogen column densities. For M31-I-B(1), we derive an upper limit as the molecular hydrogen column density is only available for a smaller beam (see Table A.1) and we expect some dilution of the signal. The contour levels correspond to excitation temperatures of 9 K (full line), 15 K (dashed line), 20 K (dotted line), and 25 K (dash-dotted line).
Current usage metrics show cumulative count of Article Views (full-text article views including HTML views, PDF and ePub downloads, according to the available data) and Abstracts Views on Vision4Press platform.
Data correspond to usage on the plateform after 2015. The current usage metrics is available 48-96 hours after online publication and is updated daily on week days.
Initial download of the metrics may take a while.