Fig. 1
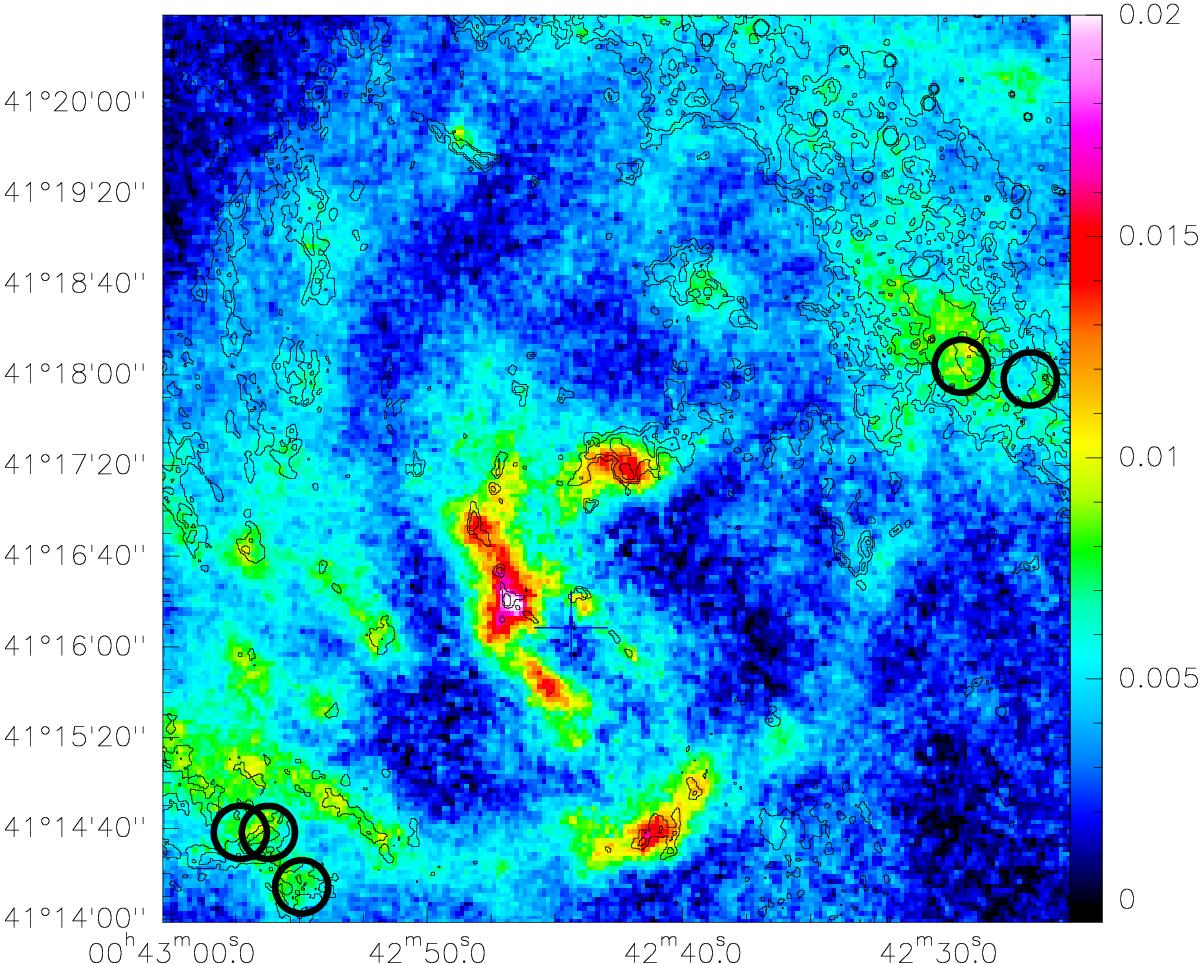
Positions observed in HCO+(1–0), HCN(1–0) and 13CO(2–1) (and C18O) are indicated with circles superimposed on the Herschel/PACS 100 μm map (Viaene et al. 2014). Contour levels (0.05, 0.1, 0.2) correspond to AB extinction computed assuming all the dust is in front of the bulge as discussed in Melchior et al. (2000). Extinction is underestimated by an unknown factor due to the uncertainties in the geometrical configuration of the gas in this area.
Current usage metrics show cumulative count of Article Views (full-text article views including HTML views, PDF and ePub downloads, according to the available data) and Abstracts Views on Vision4Press platform.
Data correspond to usage on the plateform after 2015. The current usage metrics is available 48-96 hours after online publication and is updated daily on week days.
Initial download of the metrics may take a while.