Fig. 6
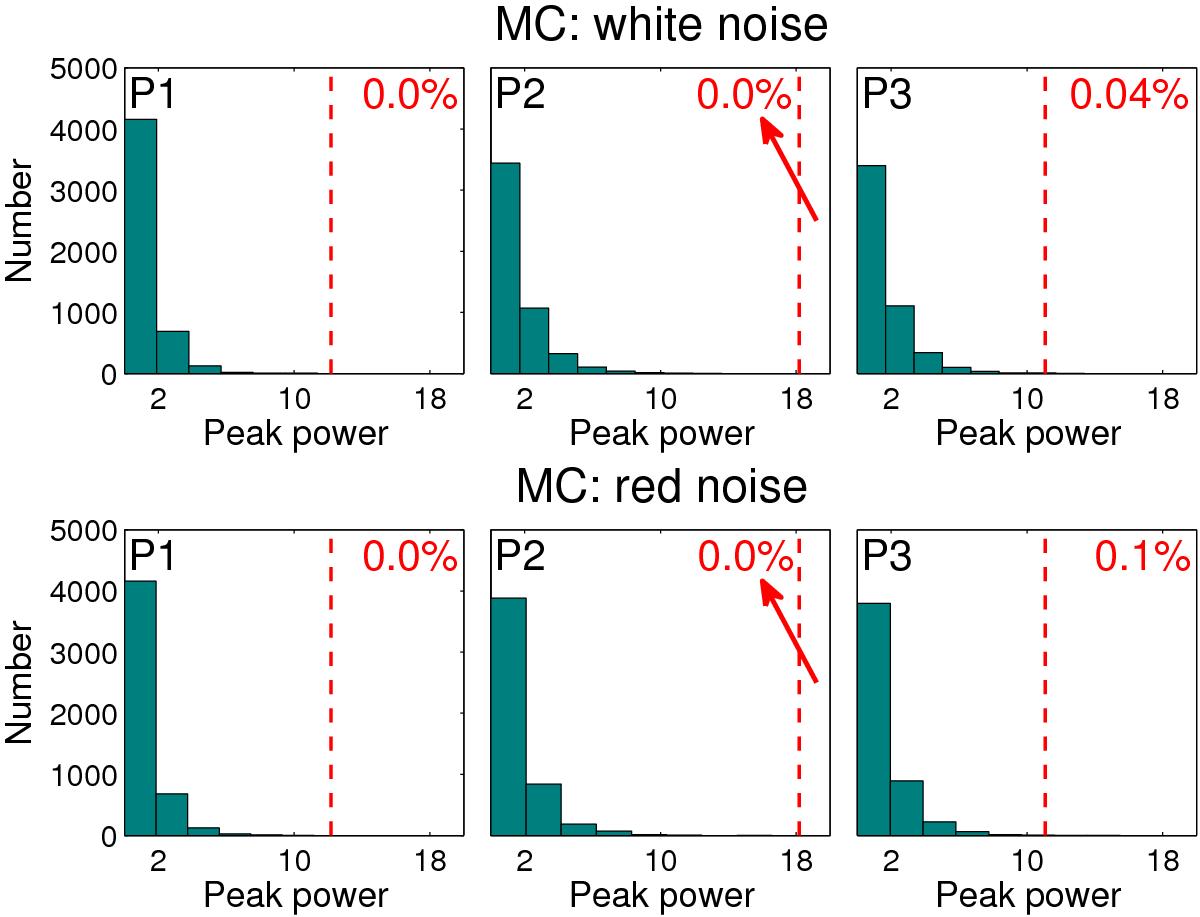
Statistical significance test of WWZ-detected periods in Figs. 2c and 3c. The x-axis represents the peak power of simulated periodograms at the periodicity under investigation. The y-axis gives the occurrence number within equally wide bins of 1. Top: histogram obtained from 5000 simulated white noise time series. Bottom: histogram obtained from 5000 simulated red noise time series. The vertical red dashed lines denote the peak powers of the periodic components identified in Figs. 2 and 3. In the regions to the right of the line, the WWZ power of the simulated fake light curves is higher than the observed value. The ratio of the accumulated count of these light curves to the total number used in the MC test (i.e. 5000) determines the probability of the observed periodicity caused by the noise.
Current usage metrics show cumulative count of Article Views (full-text article views including HTML views, PDF and ePub downloads, according to the available data) and Abstracts Views on Vision4Press platform.
Data correspond to usage on the plateform after 2015. The current usage metrics is available 48-96 hours after online publication and is updated daily on week days.
Initial download of the metrics may take a while.