Free Access
Fig. 2
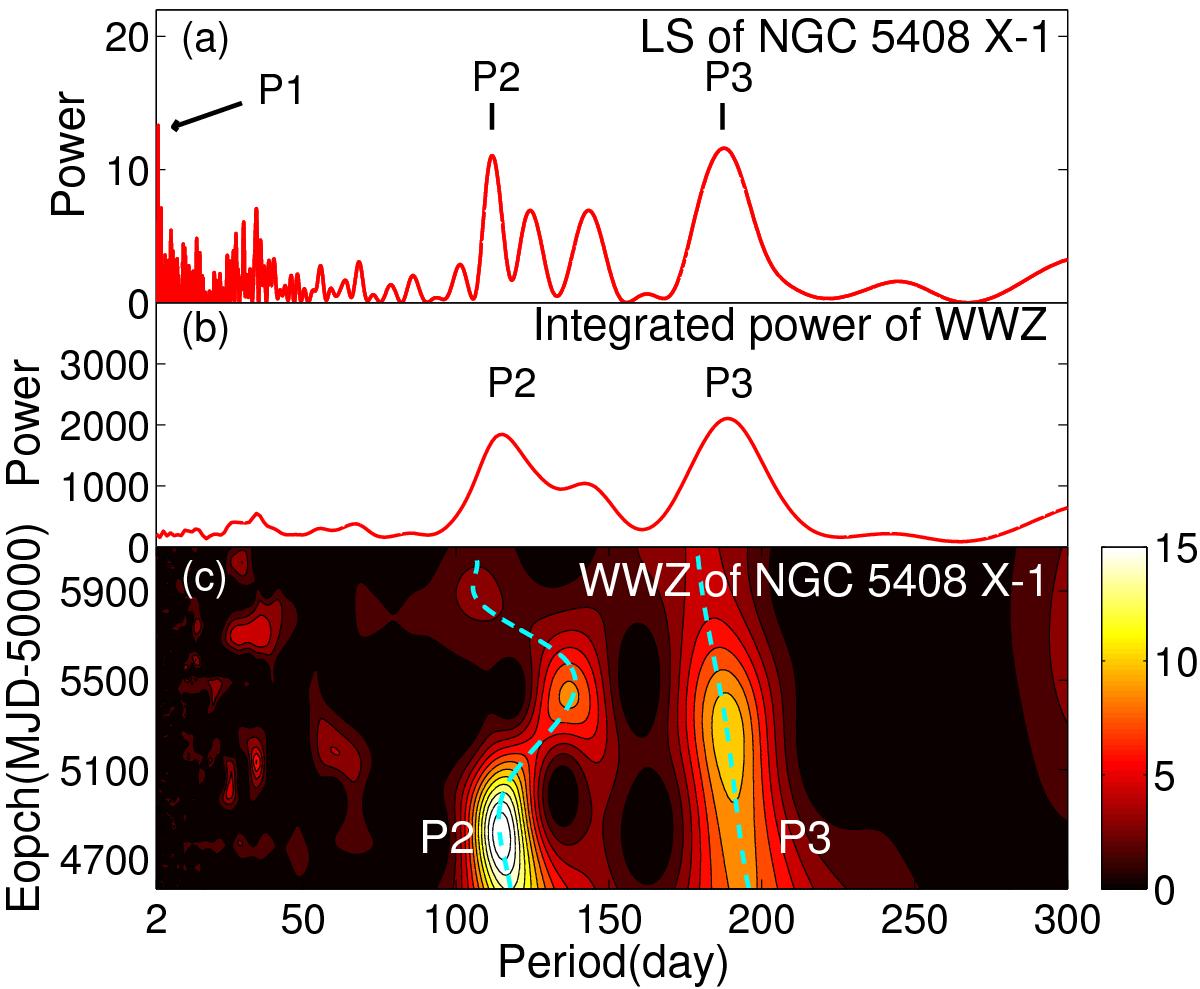
The WWZ power spectrum of NGC 5408 X-1 (bottom panel) in the test period range of 2−300 d. The WWZ spectrum is created using a decay parameter c = 0.003. For comparison, the LS periodogram is shown in the top panel, and the time-integrated WWZ power spectrum is shown in the middle panel.
Current usage metrics show cumulative count of Article Views (full-text article views including HTML views, PDF and ePub downloads, according to the available data) and Abstracts Views on Vision4Press platform.
Data correspond to usage on the plateform after 2015. The current usage metrics is available 48-96 hours after online publication and is updated daily on week days.
Initial download of the metrics may take a while.