Fig. 1
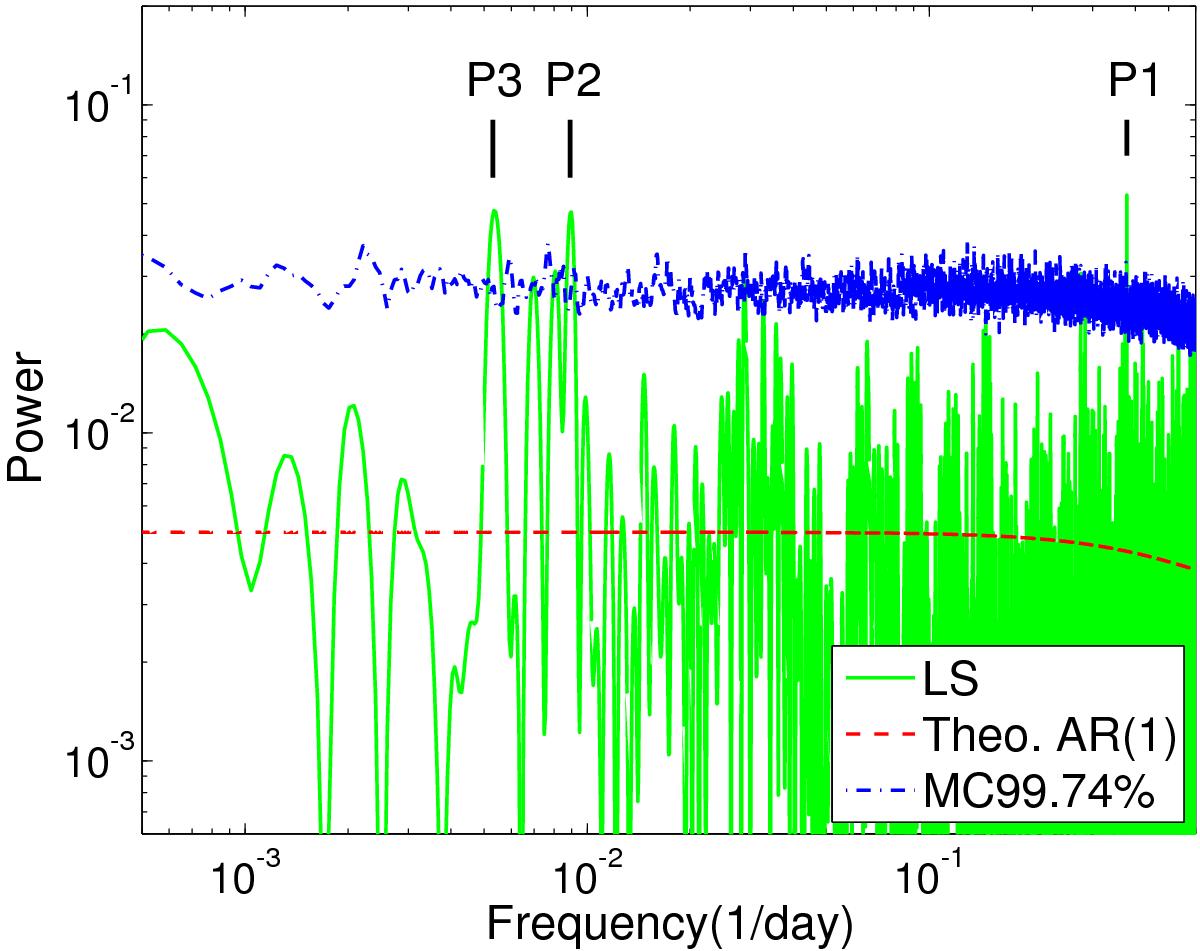
LS periodogram spectrum (green line) of NGC 5408 X-1. The red dashed curve represents the theoretical AR(1) power spectrum, and the blue dot-dashed curve marks the 99.74% (or 3σ) statistical confidence level derived from Monte Carlo simulations performed 5000 times. Three peaks (P1, P2, and P3) are above the 99.74% statistical significance level.
Current usage metrics show cumulative count of Article Views (full-text article views including HTML views, PDF and ePub downloads, according to the available data) and Abstracts Views on Vision4Press platform.
Data correspond to usage on the plateform after 2015. The current usage metrics is available 48-96 hours after online publication and is updated daily on week days.
Initial download of the metrics may take a while.