Fig. 8
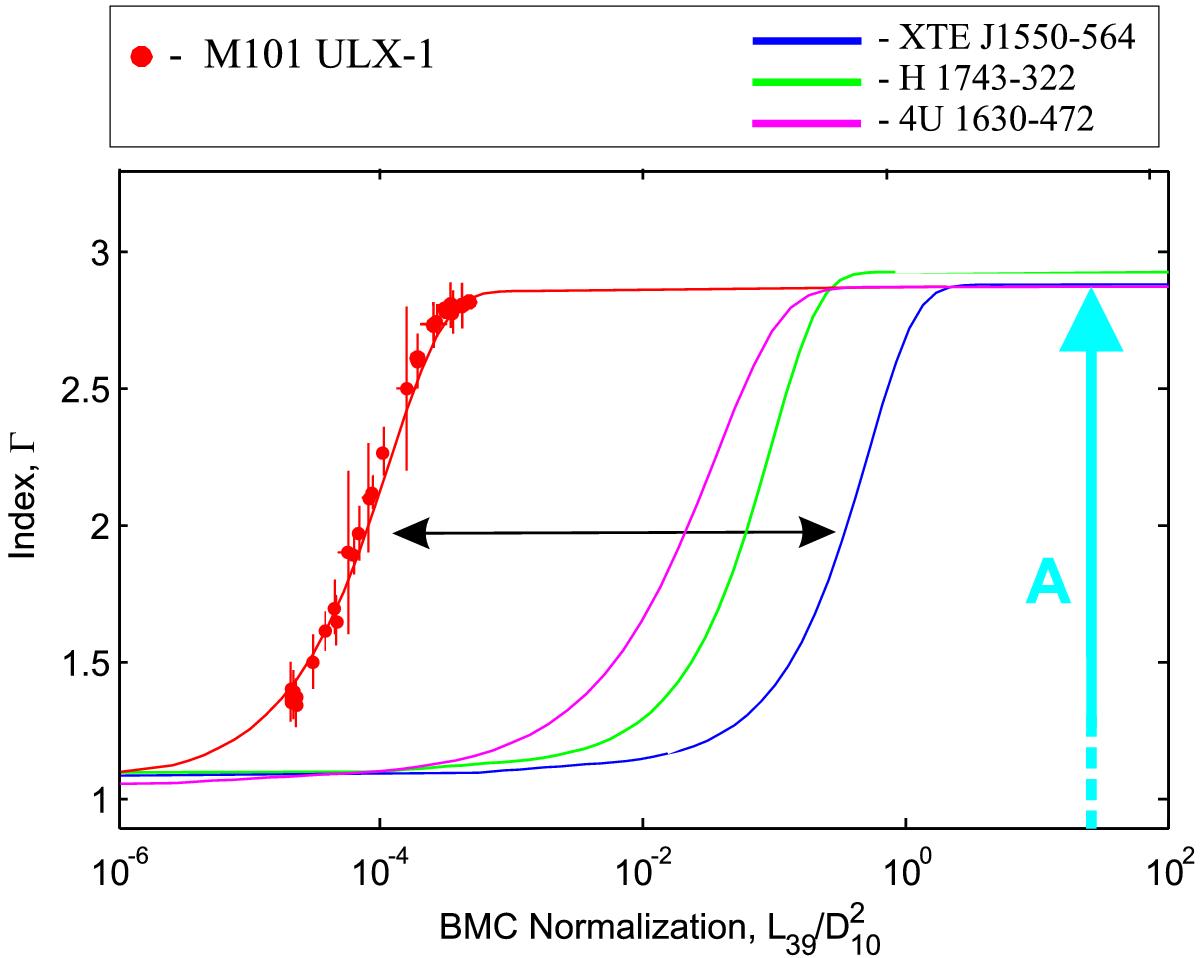
Scaling of the photon index Γ versus the normalization NBMC for M101 ULX-1 (with red points – target source) and 4U 1630-472, XTE J1550-564, and H1743-322 (with pink, blue, and green indicating the reference sources), respectively. The bright blue vertical arrow schematically shows that the parameter A is the value of the index saturation level. The horizontal black arrow stresses the fact that the correlations of the target and reference sources are similar. The only difference is in terms of the BMC normalization because of the different values of the MBH/D2 ratio.
Current usage metrics show cumulative count of Article Views (full-text article views including HTML views, PDF and ePub downloads, according to the available data) and Abstracts Views on Vision4Press platform.
Data correspond to usage on the plateform after 2015. The current usage metrics is available 48-96 hours after online publication and is updated daily on week days.
Initial download of the metrics may take a while.