Free Access
Fig. 6
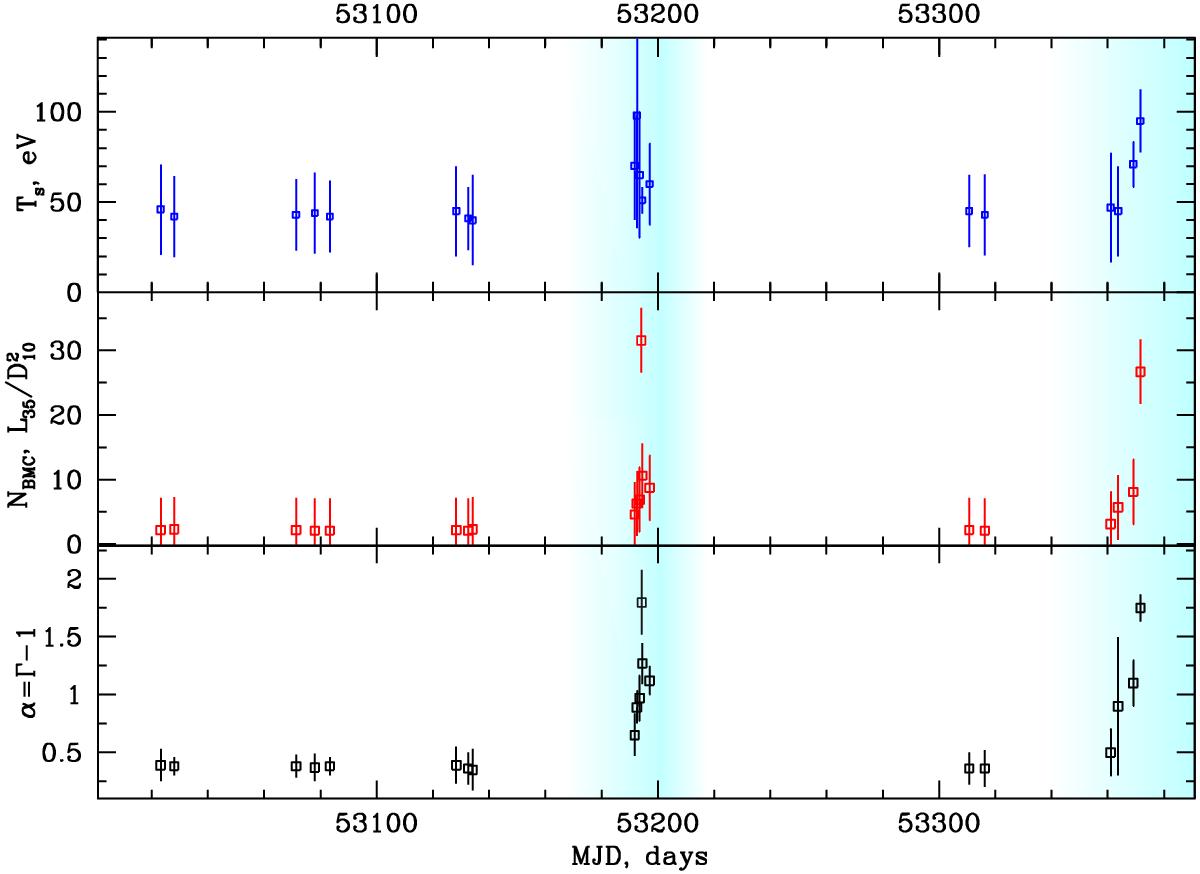
Top to bottom: evolutions of the seed photon temperature kTs in eV, the BMC normalization and the spectral index α = Γ−1 during 2004−2005 outburst transitions observed with Chandra/ACIS-S. The outburst phases of the LS−HS transitions are indicated with blue vertical strips.
Current usage metrics show cumulative count of Article Views (full-text article views including HTML views, PDF and ePub downloads, according to the available data) and Abstracts Views on Vision4Press platform.
Data correspond to usage on the plateform after 2015. The current usage metrics is available 48-96 hours after online publication and is updated daily on week days.
Initial download of the metrics may take a while.