Fig. 5
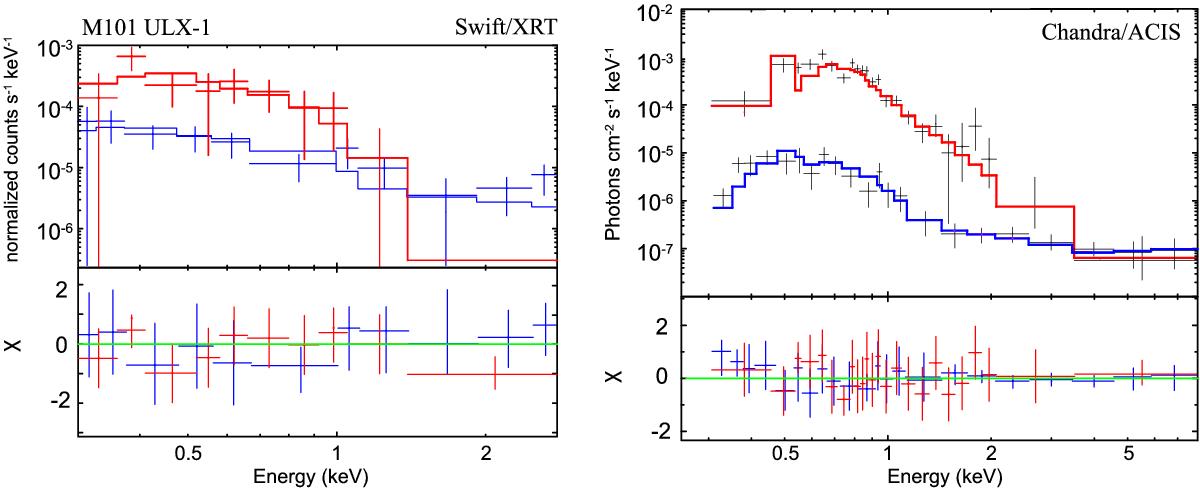
Left: Swift/XRT spectra from band A (red) and band C (blue) fitted using the bmc model. Right: two representative Chandra spectra for different states of M101 ULX-1. Data taken for 2004 July 5 (red), correspond to the high/soft state spectrum and for 2004 January−May and November (blue), correspond to the low/hard state spectrum. Spectra are fitted by a phabs*bmc model with kTbb = 70 eV (red solid line), for the high state and with kTbb = 45 eV (blue solid line), for the low state. See also the best-fit parameters listed in Tables 3 and 4 for Swift and Chandra data, respectively.
Current usage metrics show cumulative count of Article Views (full-text article views including HTML views, PDF and ePub downloads, according to the available data) and Abstracts Views on Vision4Press platform.
Data correspond to usage on the plateform after 2015. The current usage metrics is available 48-96 hours after online publication and is updated daily on week days.
Initial download of the metrics may take a while.