Fig. 4
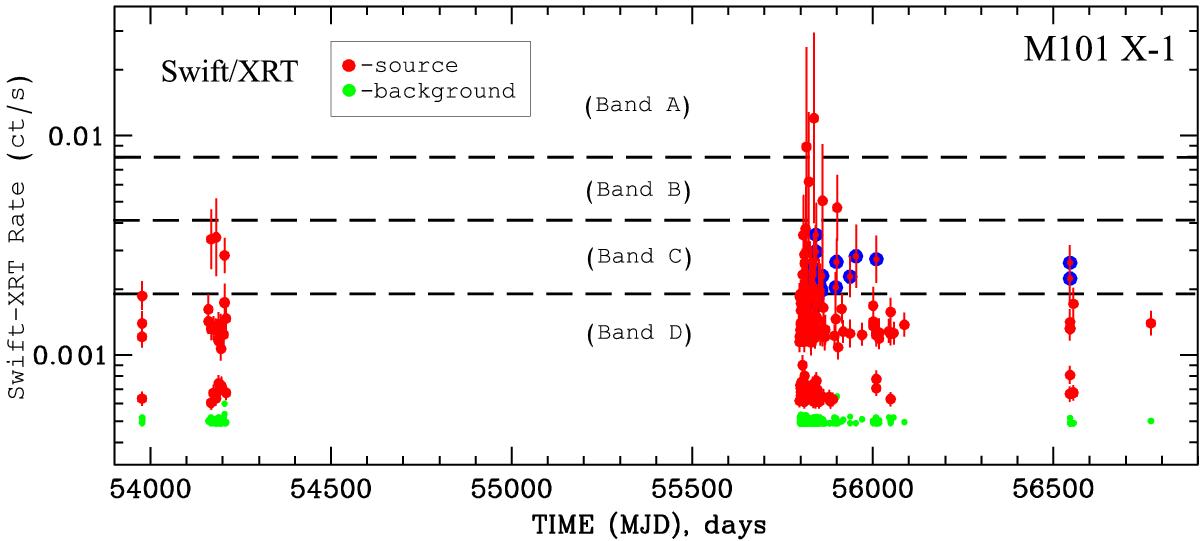
Swift/XRT light curve of M101 ULX-1 in the 0.3−10 keV band during 2006−2013. Red points denote the source signal and green points indicate the background level.Blue points indicate the decay part of the outburst for this light curve and correspond to blue points of color-intensity evolutionary diagram (see higher branch) shown in Fig. 1.
Current usage metrics show cumulative count of Article Views (full-text article views including HTML views, PDF and ePub downloads, according to the available data) and Abstracts Views on Vision4Press platform.
Data correspond to usage on the plateform after 2015. The current usage metrics is available 48-96 hours after online publication and is updated daily on week days.
Initial download of the metrics may take a while.