Free Access
Fig. 3
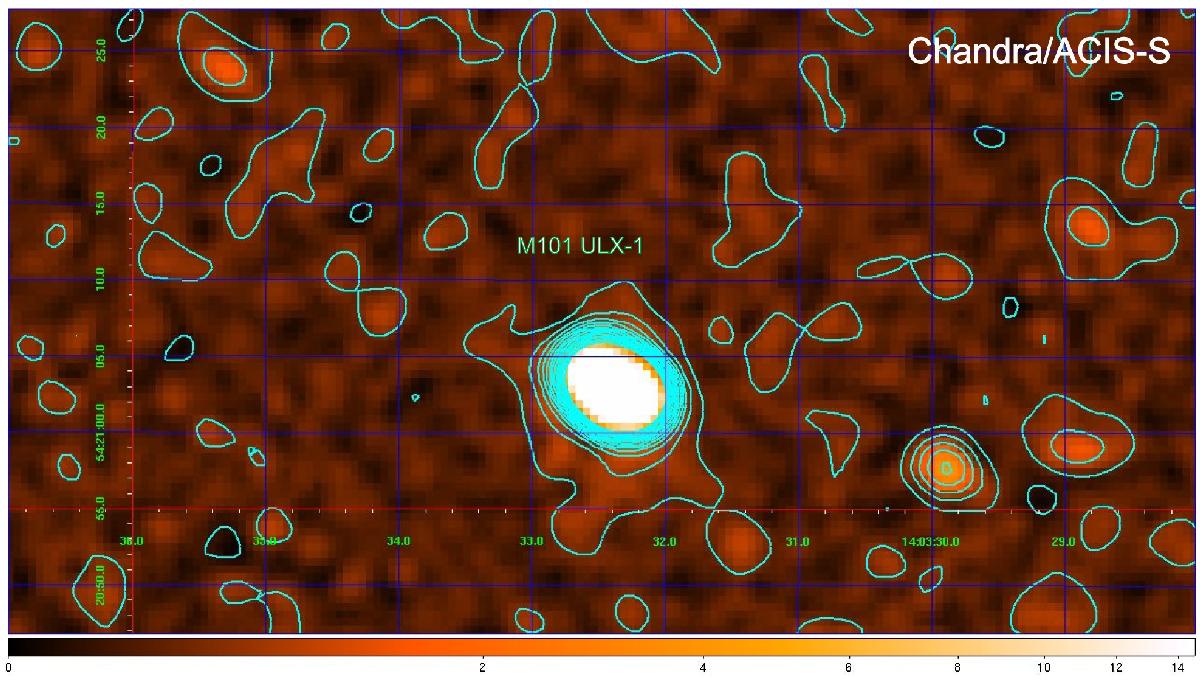
Adaptively smoothed Chandra/ACIS-S (0.2−8 keV) image of the M101 field, in which localization is indicated with the selected dashed line box in Fig. 2. Contour levels demonstrate the minimal contamination by other point sources and diffuse emission within circle of 9′′ around M101 ULX-1.
Current usage metrics show cumulative count of Article Views (full-text article views including HTML views, PDF and ePub downloads, according to the available data) and Abstracts Views on Vision4Press platform.
Data correspond to usage on the plateform after 2015. The current usage metrics is available 48-96 hours after online publication and is updated daily on week days.
Initial download of the metrics may take a while.