Fig. 1
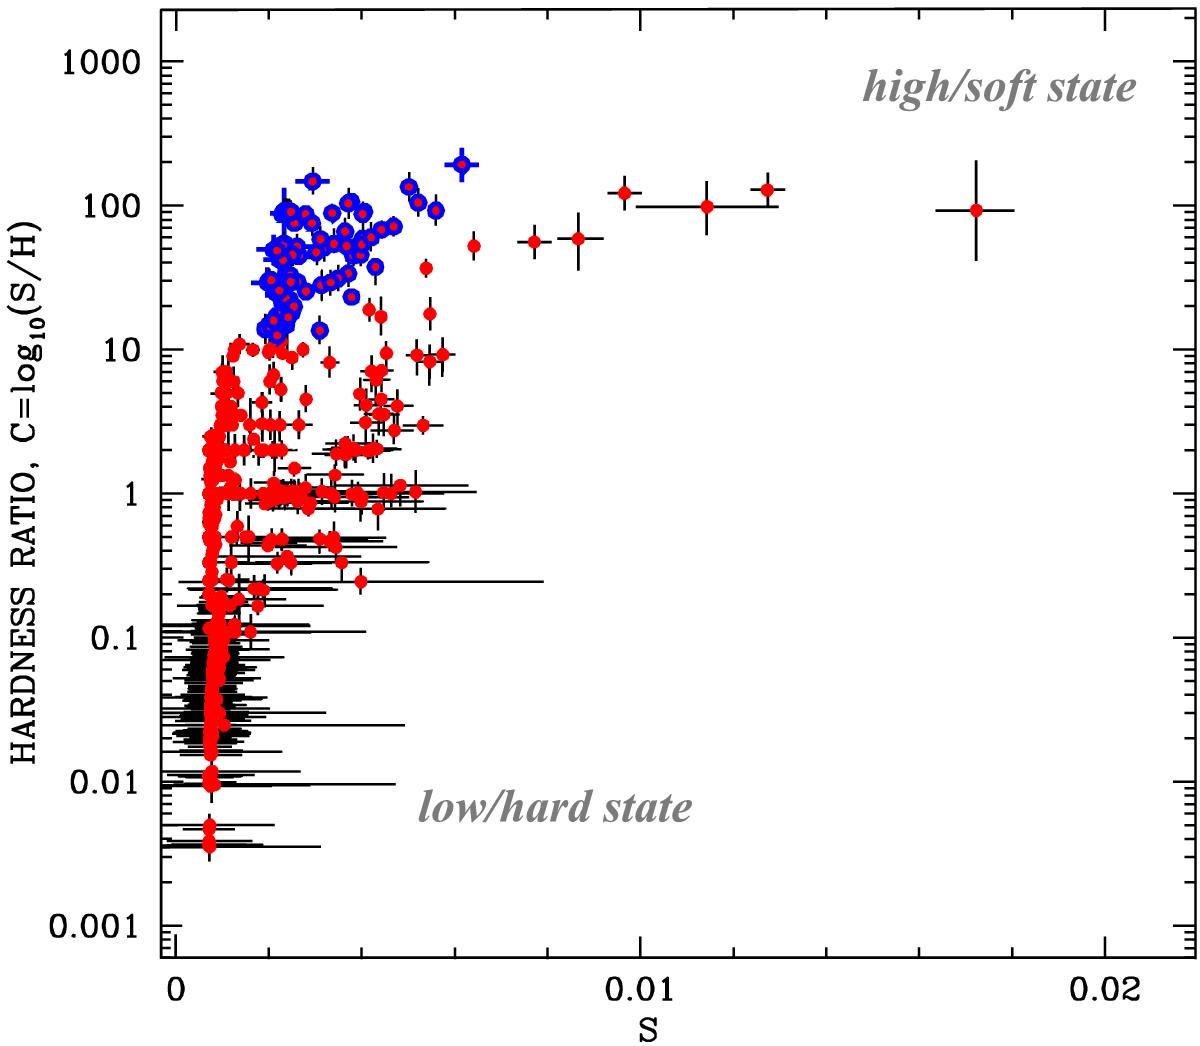
Color-intensity evolutionary diagram for M101 ULX-1 using Swift observations (2006–2012), where S and H are the source counts in the two bands: the soft [0.3−1.5 keV] and hard [1.5−10 keV] passbands. Spectral softness (hardness ratio) C and source soft brightness S increase to the right and, finally, the former saturates at high values of S. Larger values of C indicate a softer spectrum, and vice versa. Blue points are related to the decay part of the outburst (see the light curve in Fig. 4).
Current usage metrics show cumulative count of Article Views (full-text article views including HTML views, PDF and ePub downloads, according to the available data) and Abstracts Views on Vision4Press platform.
Data correspond to usage on the plateform after 2015. The current usage metrics is available 48-96 hours after online publication and is updated daily on week days.
Initial download of the metrics may take a while.