Fig. 7
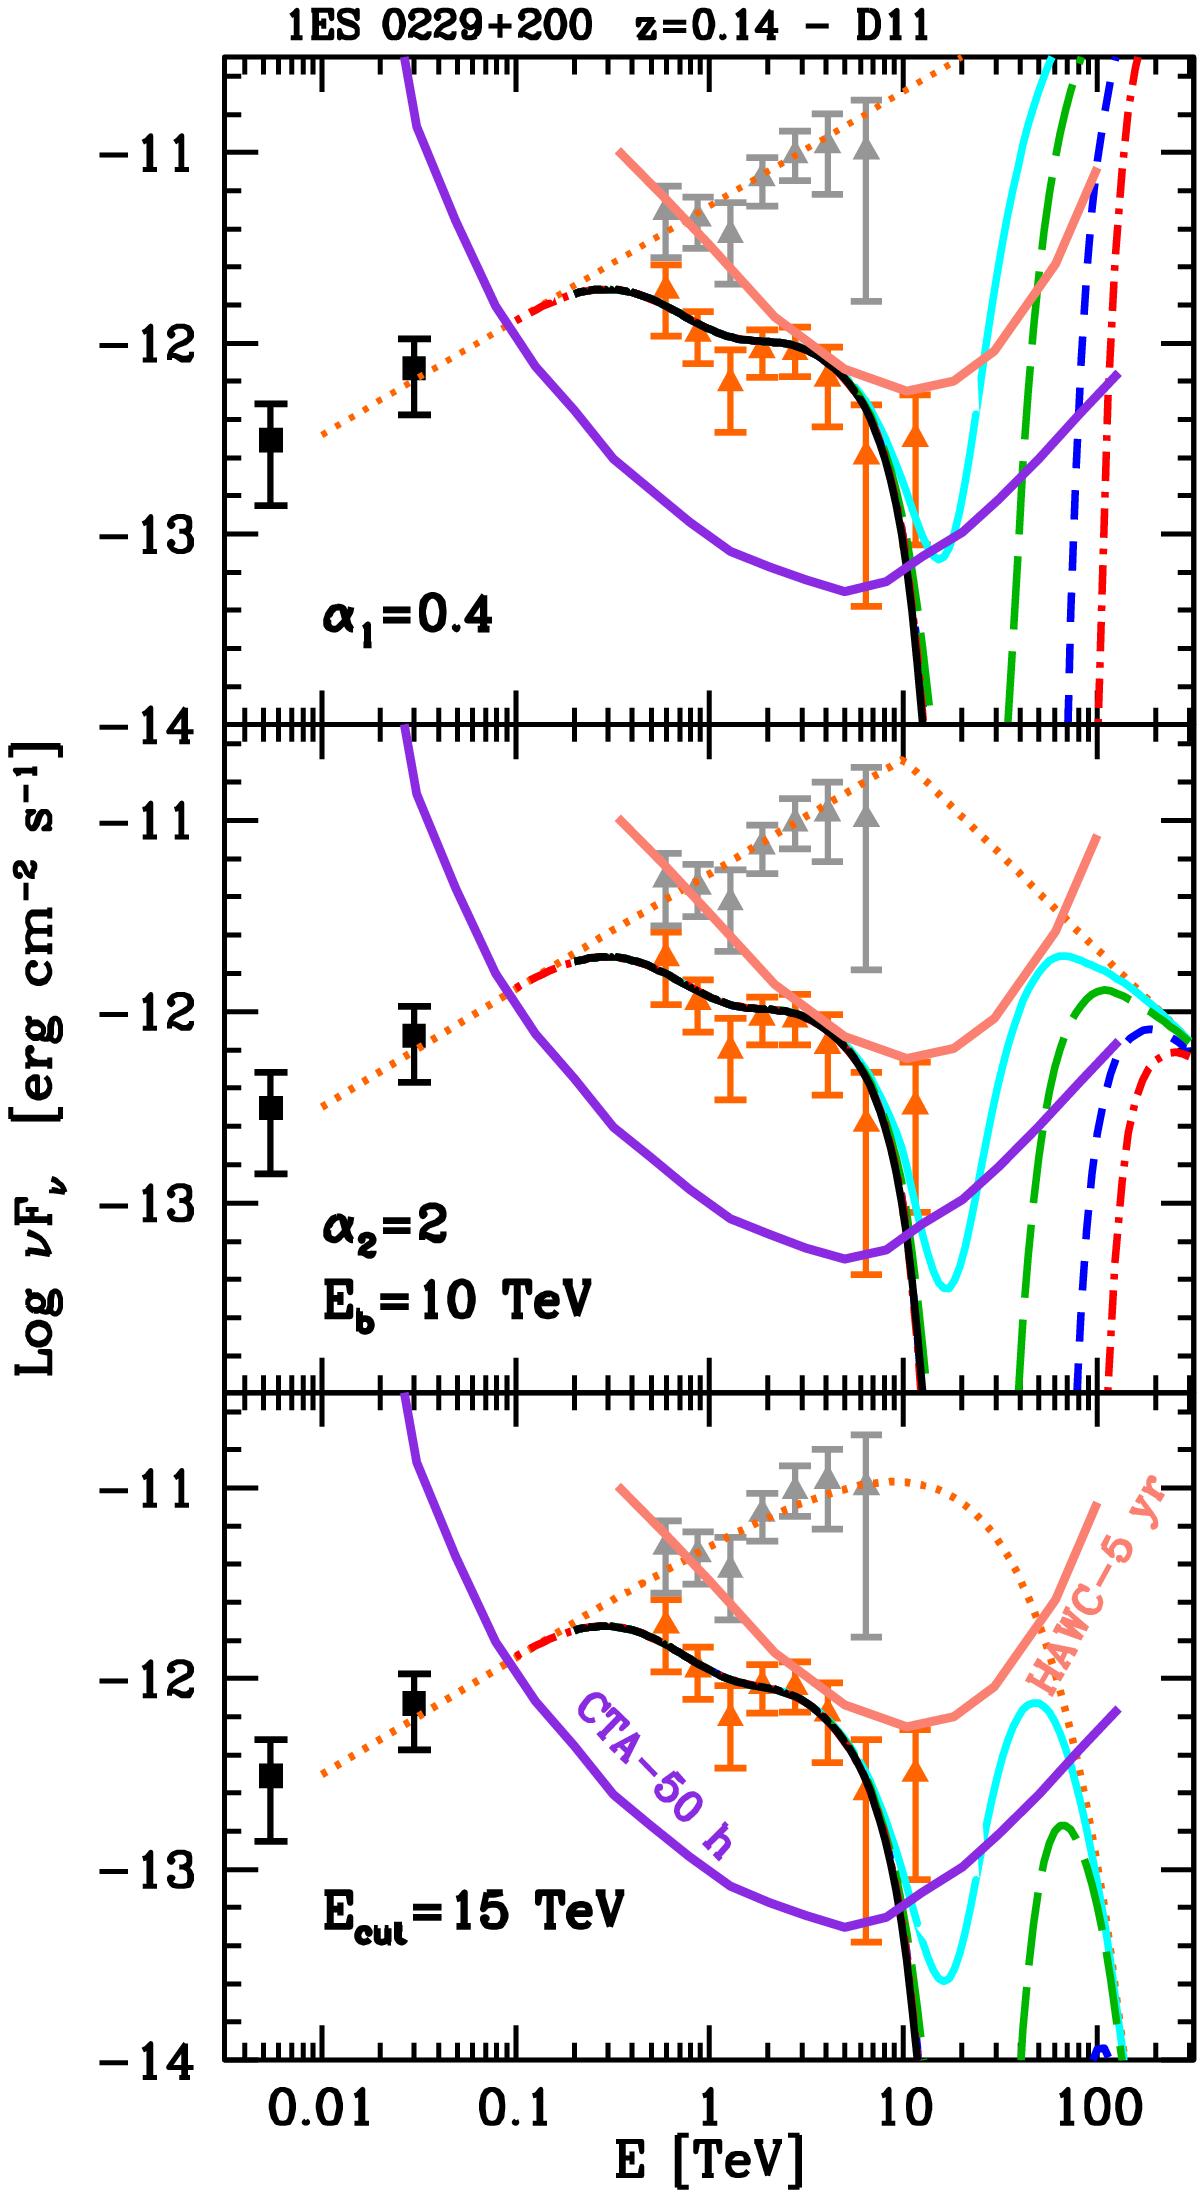
Observed high-energy SED of 1ES 0229+200. Black symbols are LAT measurements from the 3FGL catalogue. Orange triangles indicate the HESS spectrum (Aharonian et al. 2007) while the gray triangles indicate fluxes that are obtained after correction for the absorption with EBL. The dotted line indicates the assumed intrinsic spectrum. The three panels report the received γ-ray spectrum for different assumed intrinsic spectra (from top to bottom: a simple power law with energy index α = 0.4; a broken power law with high-energy index α2 = 2 and break energy Eb = 10 TeV; an exponential cut-off with e-folding energy Ecut = 15 TeV) and values of ELIV (color code as in Fig. 2). The HAWC and CTA sensitivity curves (as in Fig. 3) are displayed for an exposure time of five years and 50 h, respectively.
Current usage metrics show cumulative count of Article Views (full-text article views including HTML views, PDF and ePub downloads, according to the available data) and Abstracts Views on Vision4Press platform.
Data correspond to usage on the plateform after 2015. The current usage metrics is available 48-96 hours after online publication and is updated daily on week days.
Initial download of the metrics may take a while.