Fig. 5
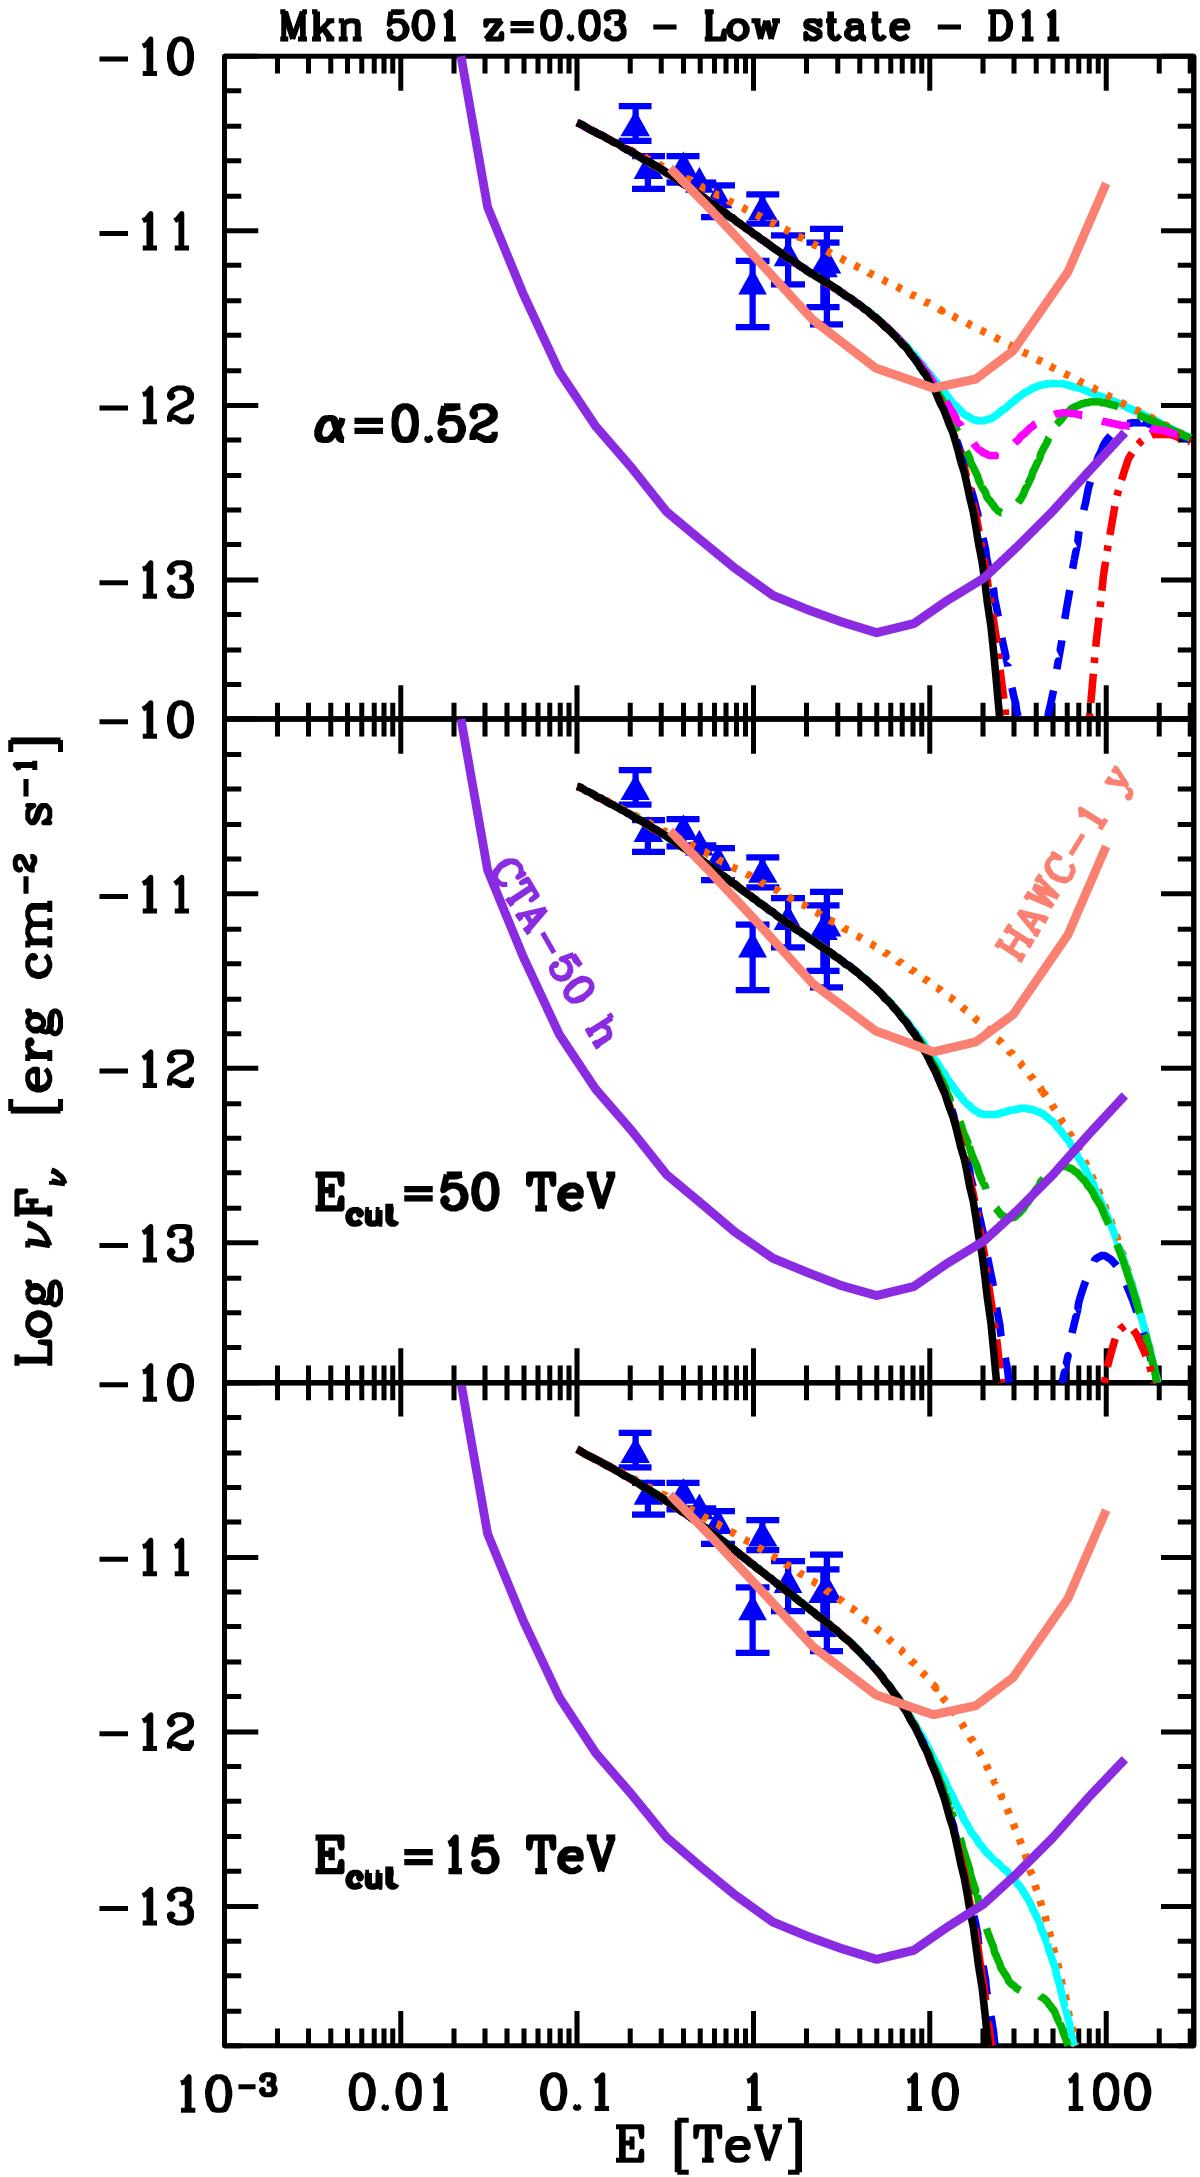
Observed γ-ray spectrum of Mkn 501 during a quiescent phase (Acciari et al. 2011). The three panels report the received γ-ray spectrum for different assumed intrinsic spectra (from top to bottom: a simple power law with energy index α = 0.52; a power law with energy index α = 0.52 and an exponential cut-off with e-folding energy Ecut = 50 TeV; a cut-offed power law with α = 0.52 and Ecut = 15 TeV) and values of ELIV (color code as in Fig. 2). The HAWC and CTA sensitivity curves (as in Fig. 3) are displayed for an exposure time of one year and 50 h, respectively.
Current usage metrics show cumulative count of Article Views (full-text article views including HTML views, PDF and ePub downloads, according to the available data) and Abstracts Views on Vision4Press platform.
Data correspond to usage on the plateform after 2015. The current usage metrics is available 48-96 hours after online publication and is updated daily on week days.
Initial download of the metrics may take a while.