Fig. 4
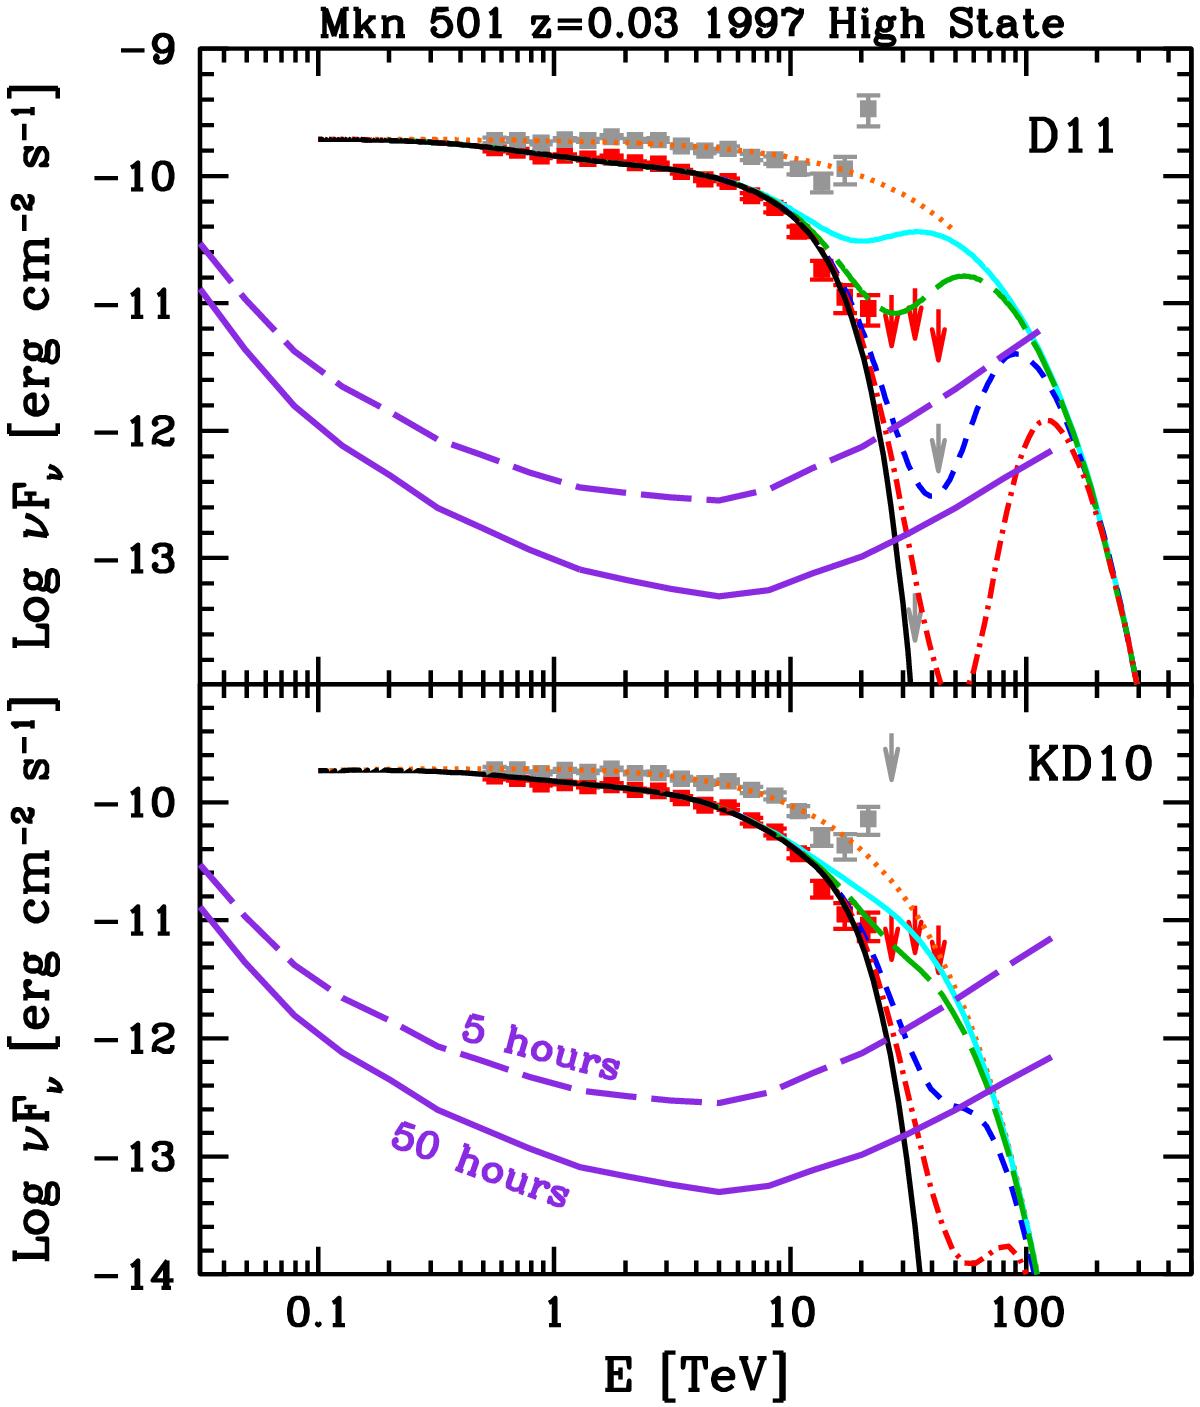
Observed γ-ray spectrum of Mkn 501 during the 1997 active state recorded HEGRA (red symbols). The black solid and dotted orange lines show the observed and the intrinsic spectrum, assuming standard absorption with the D11 (upper panel) and KD10 (lower panel) EBL models. Grey points indicate the observed data points corrected for absorption. Other lines show the predicted spectrum with LIV effects (line styles and colors as in Fig. 2). The violet lines show the 5σ sensitivity curves for CTA (5 h, dashed and 50 h exposure, solid).
Current usage metrics show cumulative count of Article Views (full-text article views including HTML views, PDF and ePub downloads, according to the available data) and Abstracts Views on Vision4Press platform.
Data correspond to usage on the plateform after 2015. The current usage metrics is available 48-96 hours after online publication and is updated daily on week days.
Initial download of the metrics may take a while.