Free Access
Fig. 3
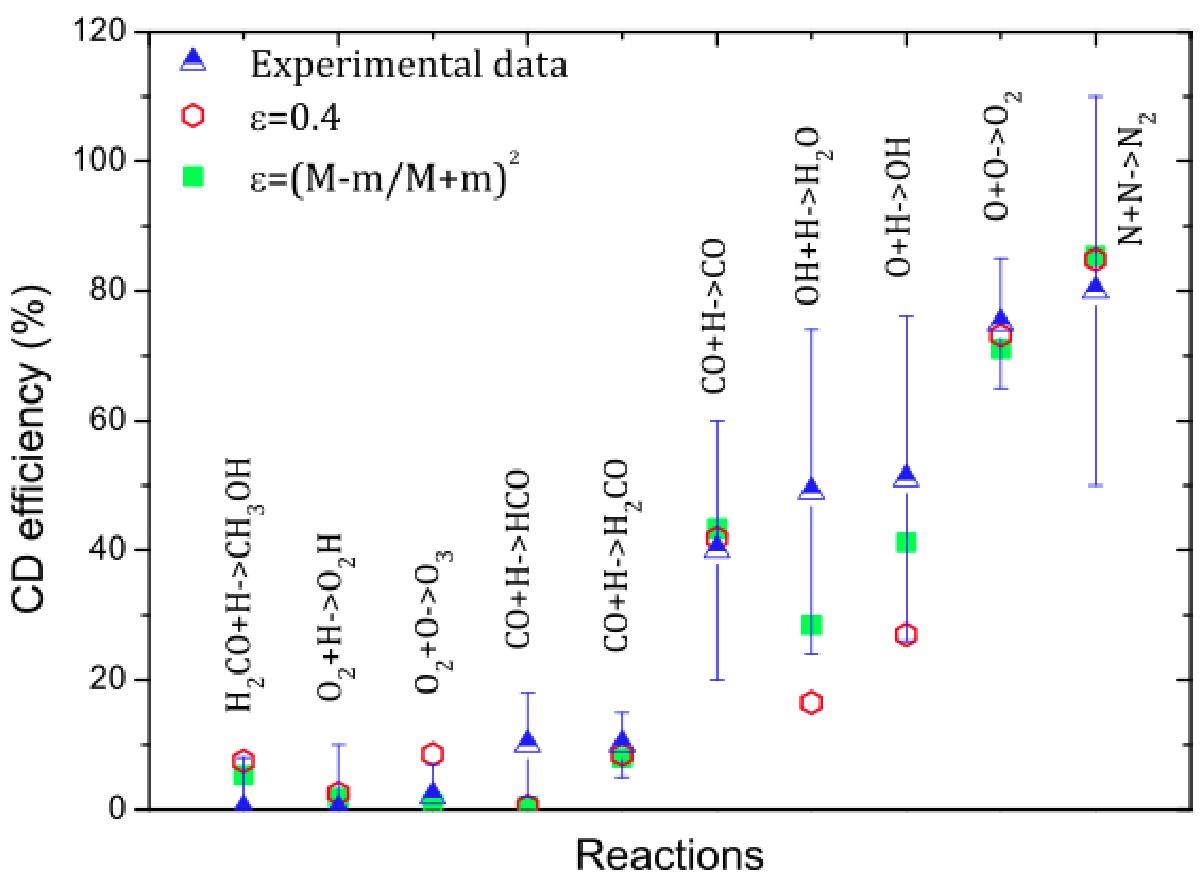
Measured CD efficiencies plotted in blue with error bars. In green we show the result of the formulae (Eq. (2)) that include division between the degree of freedom and the fraction of kinetic energy after bounce (ϵ is mass dependent). In red we show the equal share of energy and the constant value of ϵ.
Current usage metrics show cumulative count of Article Views (full-text article views including HTML views, PDF and ePub downloads, according to the available data) and Abstracts Views on Vision4Press platform.
Data correspond to usage on the plateform after 2015. The current usage metrics is available 48-96 hours after online publication and is updated daily on week days.
Initial download of the metrics may take a while.