Fig. 1
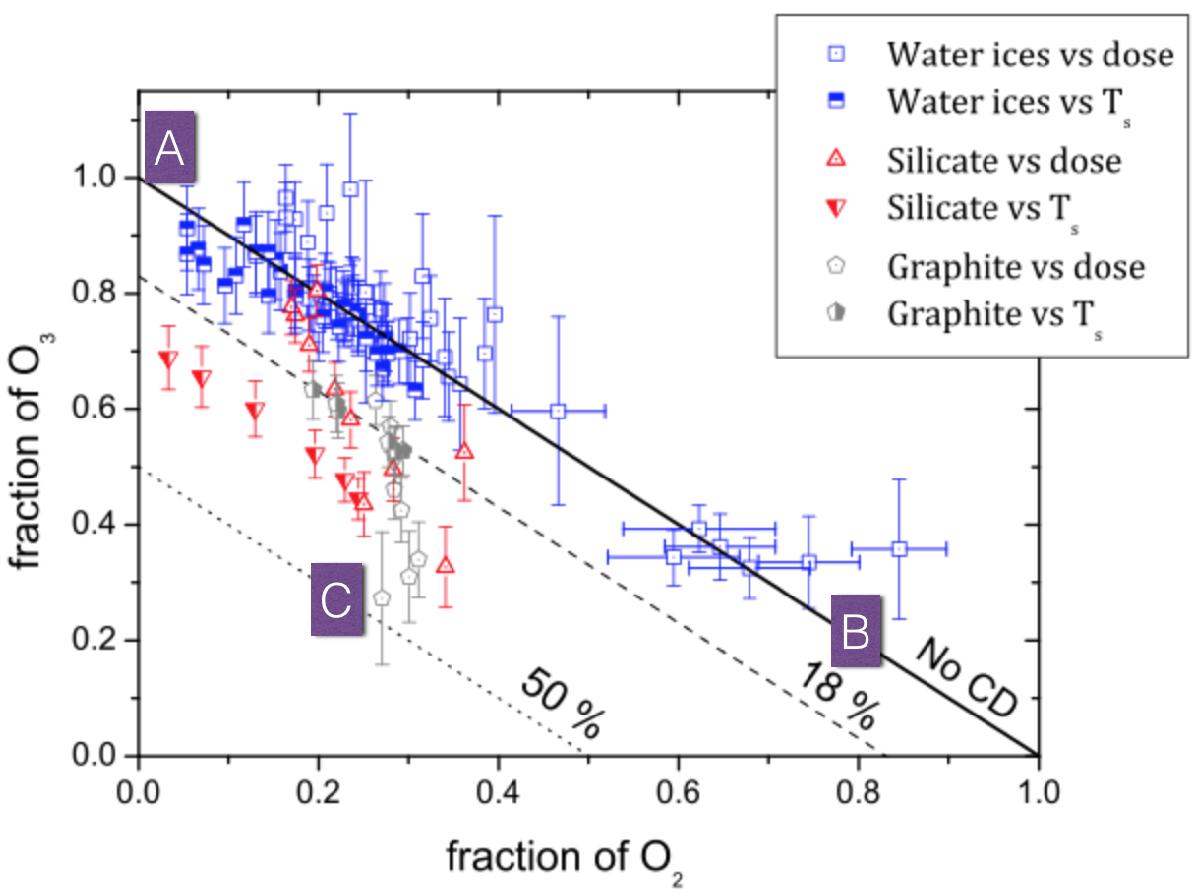
Normalized fraction of O2 and O3 for the [O+O] reactive system obtained after TPD. The filled symbols represent the surface temperature variation (between 6.5 K and 25 K), while the empty symbols represent the dose variation (between 0.05 ML and 1.0 ML). The black dots represent the data of Minissale & Dulieu (2014), who reported the method in detail. Other points are adopted from Minissale et al. (2013), Minissale et al. (2014), and Congiu et al. (2014) or are original data. The solid black line represents the zone of the plot in which no chemical desorption is measured.
Current usage metrics show cumulative count of Article Views (full-text article views including HTML views, PDF and ePub downloads, according to the available data) and Abstracts Views on Vision4Press platform.
Data correspond to usage on the plateform after 2015. The current usage metrics is available 48-96 hours after online publication and is updated daily on week days.
Initial download of the metrics may take a while.