Fig. 9
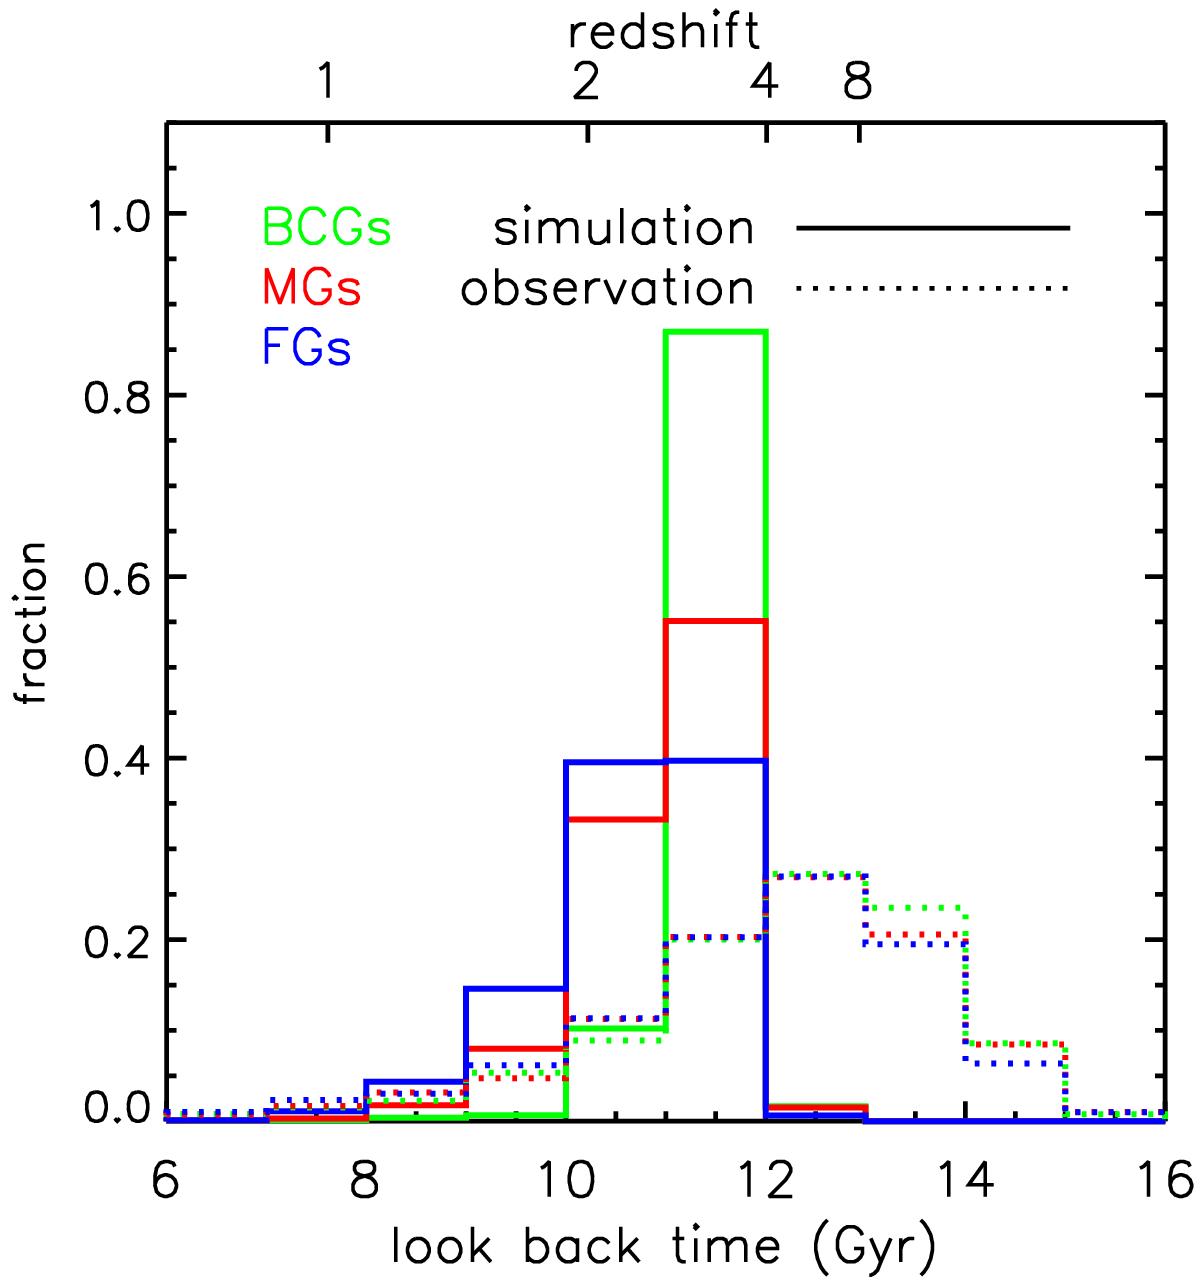
Distribution of the mass-weighted ages for sample galaxies in different types. The green, red, and blue lines represent the samples of BCGs, MGs, and FGs, respectively. The thin dotted lines represents the age distribution obtained for LRGs with velocity dispersion > 210 km s-1 by the full spectrum fitting in this paper, and the thick solid lines represent the age distributions obtained from a semi-analytic galaxy formation model (Guo et al. 2011). Some SDSS LRGs appear to have ages or lookback times of 15 Gyr, larger than the Hubble time, because of measurement errors in the STARLIGHT-derived ages.
Current usage metrics show cumulative count of Article Views (full-text article views including HTML views, PDF and ePub downloads, according to the available data) and Abstracts Views on Vision4Press platform.
Data correspond to usage on the plateform after 2015. The current usage metrics is available 48-96 hours after online publication and is updated daily on week days.
Initial download of the metrics may take a while.