Fig. 8
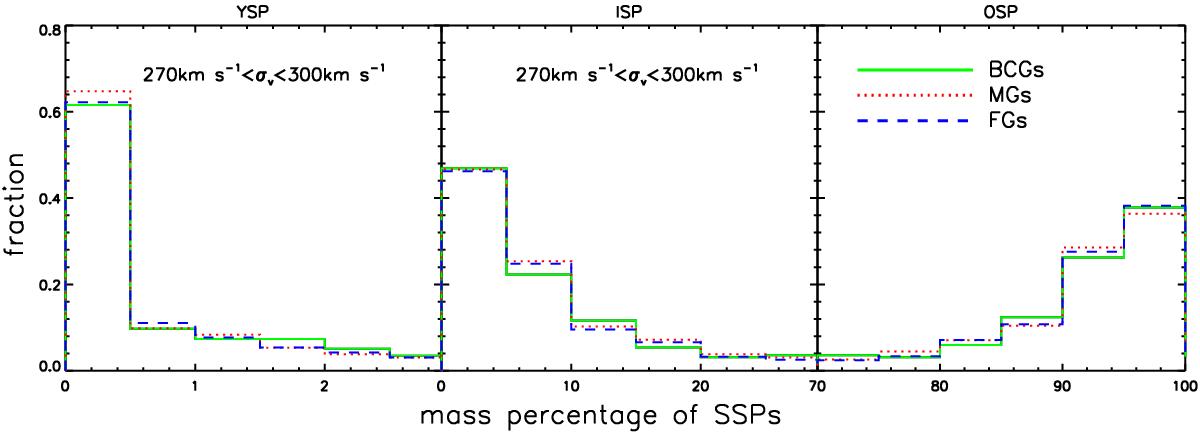
Distributions of the mass fraction of different SSPs for LRGs in different subsamples. As an example, only the distributions obtained for those galaxies with velocity dispersions σv> 300 km s-1 are shown here. Histograms shown by the solid (green), dotted (red), and dashed (blue) lines represent the distributions for BCGs, MGs, and FGs, respectively.
Current usage metrics show cumulative count of Article Views (full-text article views including HTML views, PDF and ePub downloads, according to the available data) and Abstracts Views on Vision4Press platform.
Data correspond to usage on the plateform after 2015. The current usage metrics is available 48-96 hours after online publication and is updated daily on week days.
Initial download of the metrics may take a while.