Fig. 7
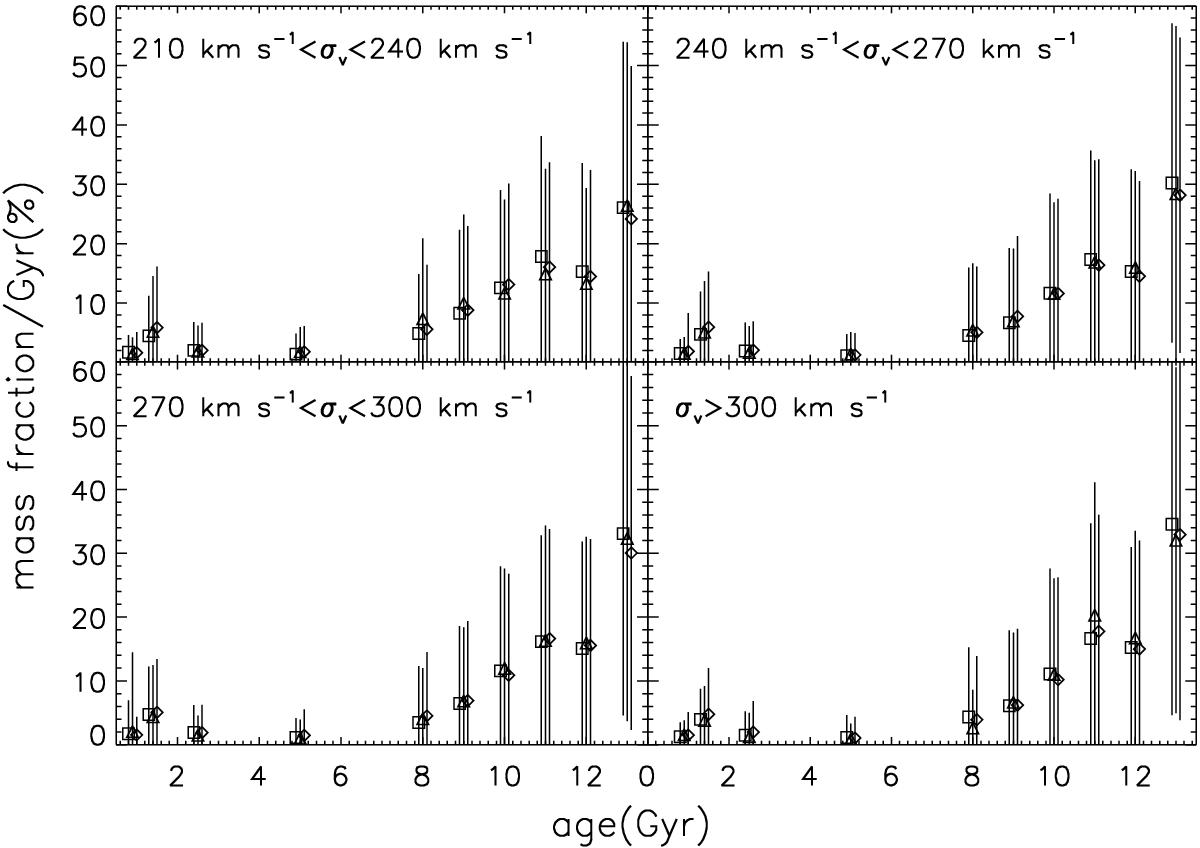
Mean mass fraction of SSPs with different ages for the subsamples with different velocity dispersions. Squares, triangles, and diamonds represent the mean mass fraction of SSPs for BCGs, MGs, and FGs, respectively. The bar associated with each symbol represents the standard deviation of the mean mass fraction. For clarity, symbols representing an SSP with the same age but for different sub-samples are offset by δt = −0.1, 0, and 0.1, respectively.
Current usage metrics show cumulative count of Article Views (full-text article views including HTML views, PDF and ePub downloads, according to the available data) and Abstracts Views on Vision4Press platform.
Data correspond to usage on the plateform after 2015. The current usage metrics is available 48-96 hours after online publication and is updated daily on week days.
Initial download of the metrics may take a while.