Free Access
Fig. 2
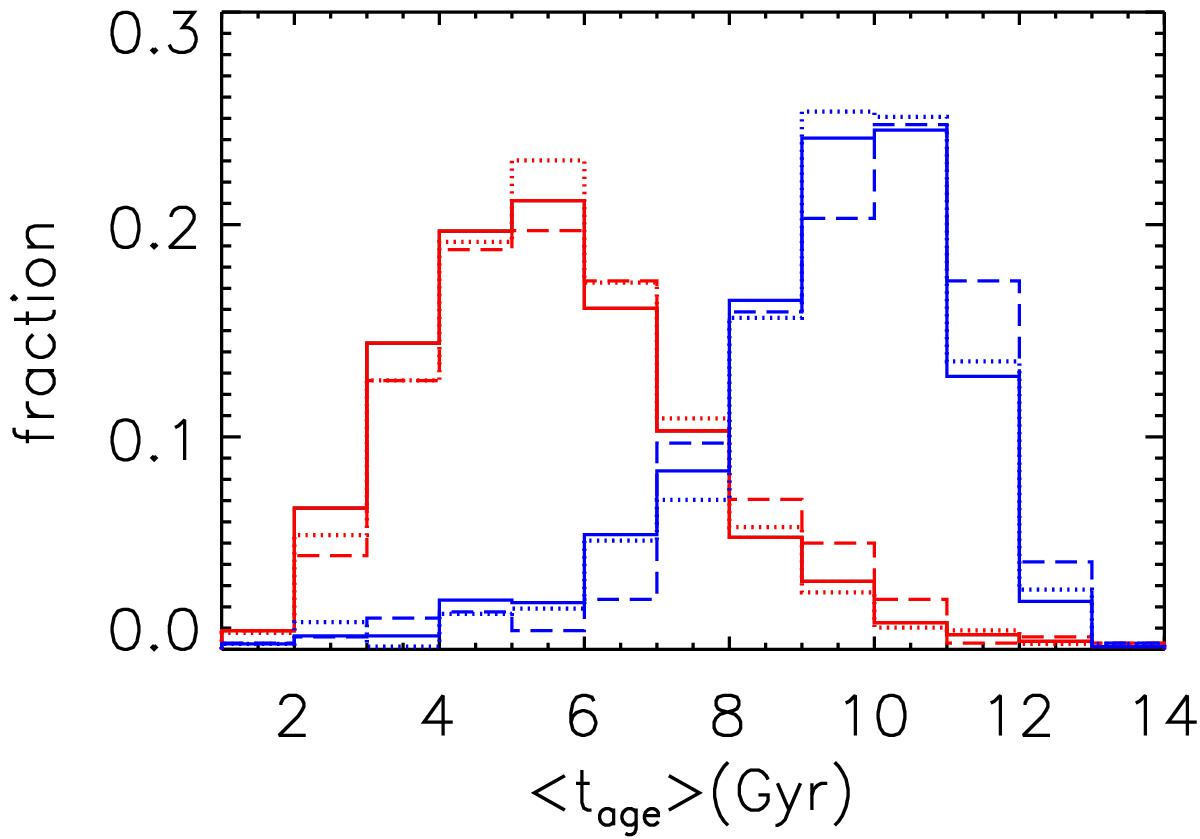
Distributions of the mass-weighted (blue histograms) and the light-weighted ages (red histograms) of BCGs. Histograms shown by the solid dotted and long dashed lines represent the distributions of BCGs in galaxy clusters with richness RL in the range of 12−22, 22−39, and > 39, respectively.
Current usage metrics show cumulative count of Article Views (full-text article views including HTML views, PDF and ePub downloads, according to the available data) and Abstracts Views on Vision4Press platform.
Data correspond to usage on the plateform after 2015. The current usage metrics is available 48-96 hours after online publication and is updated daily on week days.
Initial download of the metrics may take a while.