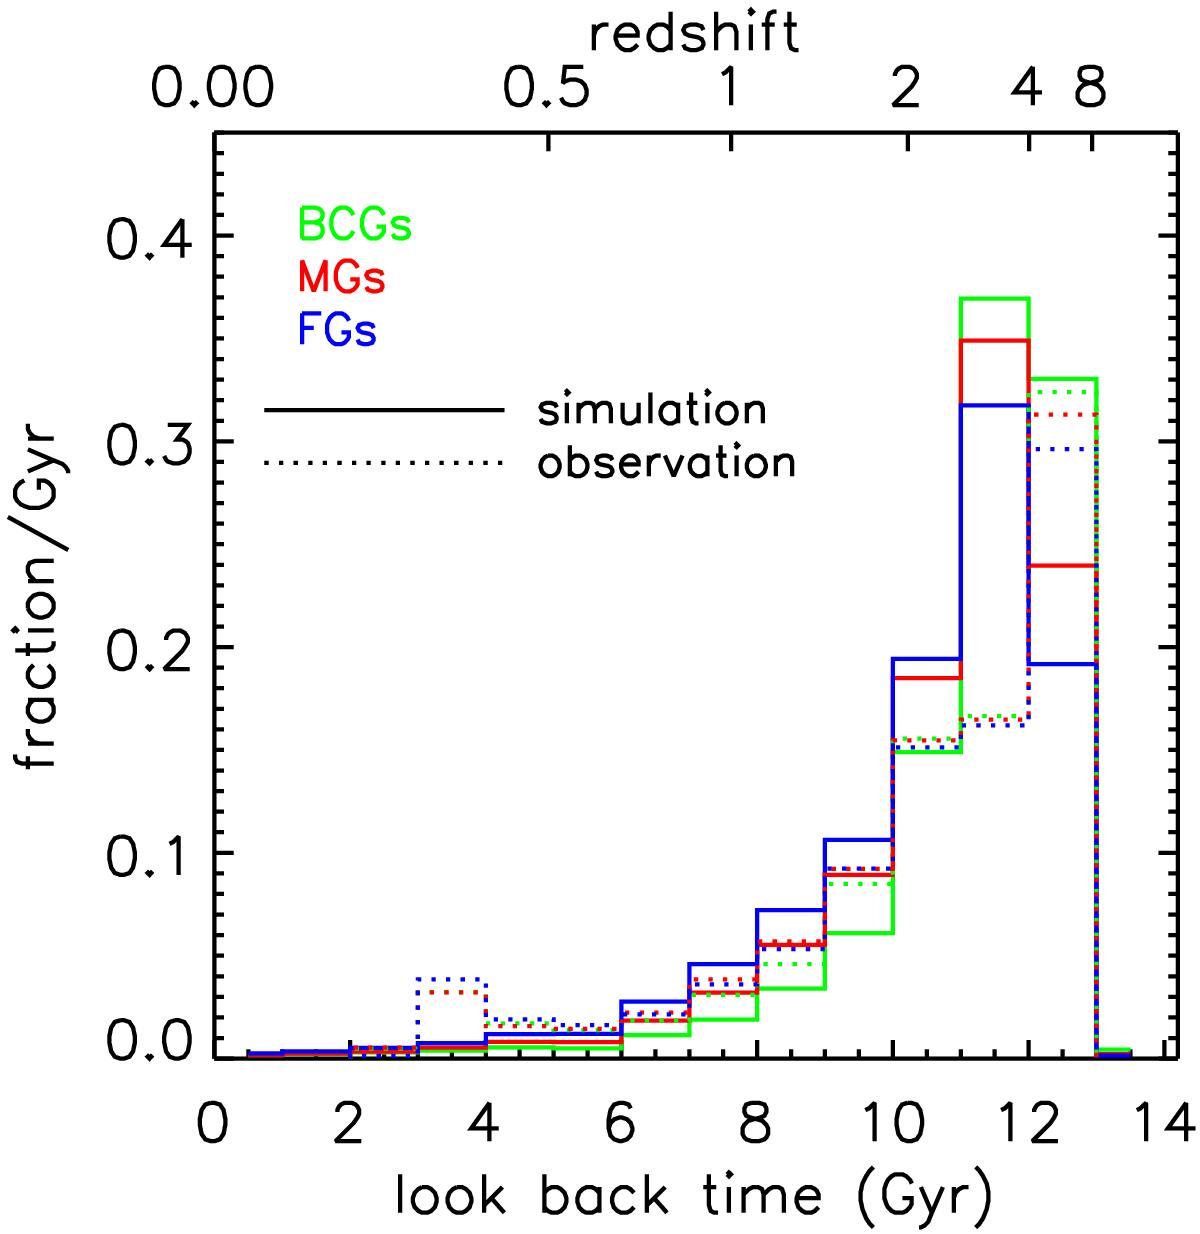
Fig. 12

Mean star formation histories of different types of LRGs. The SFH of a galaxy is represented by the mass ratio of stars formed per Gyr around any given lookback time t to the total stellar mass. The solid green, red, and blue histograms represent the mean value of the mass growth history for BCGs, MGs, and FGs obtained from a semi-analytical model (Guo et al. 2011), respectively; the dotted histograms are obtained from the full spectrum fitting for the SDSS BCGs, MGs, and FGs, respectively.
Current usage metrics show cumulative count of Article Views (full-text article views including HTML views, PDF and ePub downloads, according to the available data) and Abstracts Views on Vision4Press platform.
Data correspond to usage on the plateform after 2015. The current usage metrics is available 48-96 hours after online publication and is updated daily on week days.
Initial download of the metrics may take a while.


