Fig. 10
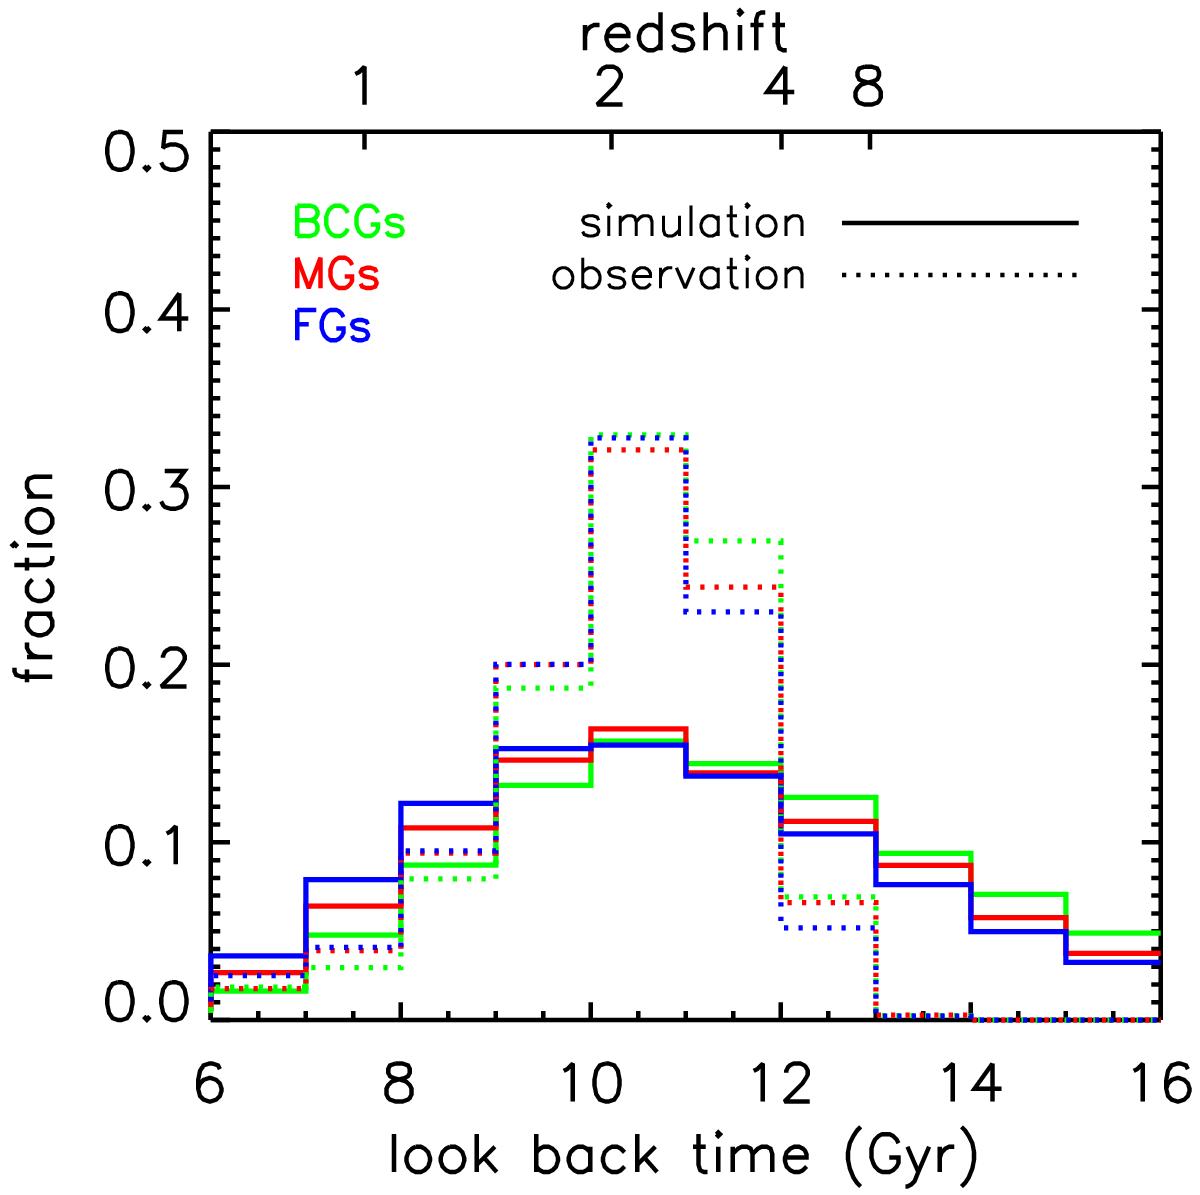
Comparison between the mass-weighted ages obtained from simulation and those obtained from observations by considering the measurement errors. The green, red, and blue lines represent the samples of BCGs, MGs, and FGs, respectively. The thin dotted lines represent the age distributions obtained for different LRG samples by the full spectrum fitting in this paper, after adding a correction of −0.09 dex, and the thick solid lines represent the age distributions obtained from a semi-analytic galaxy formation model (Guo et al. 2011) by considering a scatter of 0.1 dex.
Current usage metrics show cumulative count of Article Views (full-text article views including HTML views, PDF and ePub downloads, according to the available data) and Abstracts Views on Vision4Press platform.
Data correspond to usage on the plateform after 2015. The current usage metrics is available 48-96 hours after online publication and is updated daily on week days.
Initial download of the metrics may take a while.