Fig. 1
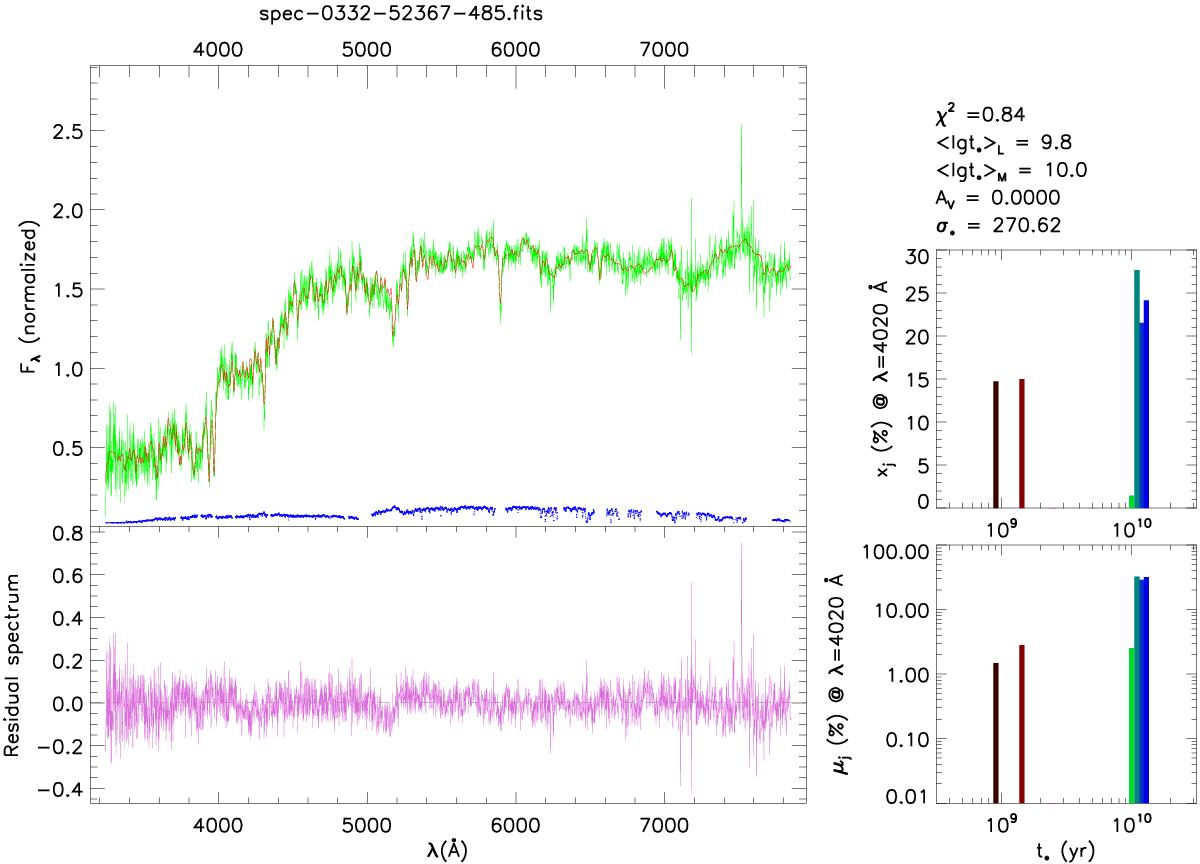
Example for the full spectrum fitting of the spectrum of a BCG. The green, blue, and red lines in the top left panel represent the observed spectrum (Oλ), its error spectrum, and the model spectrum (Mλ), respectively. The residual spectrum (Eλ) is shown by the purple line in the bottom left panel. In the left panels, both Oλ and Mλ are scaled by normalizing the flux at wavelength 4020 Å to 1. The light-weighted and the mass-weighted fractions of stellar populations, i.e., xj and μj, are shown in the top and the bottom right panels, respectively. Several quantities (see Sect. 3) derived from the fitting are listed in the top right corner.
Current usage metrics show cumulative count of Article Views (full-text article views including HTML views, PDF and ePub downloads, according to the available data) and Abstracts Views on Vision4Press platform.
Data correspond to usage on the plateform after 2015. The current usage metrics is available 48-96 hours after online publication and is updated daily on week days.
Initial download of the metrics may take a while.