Fig. 8
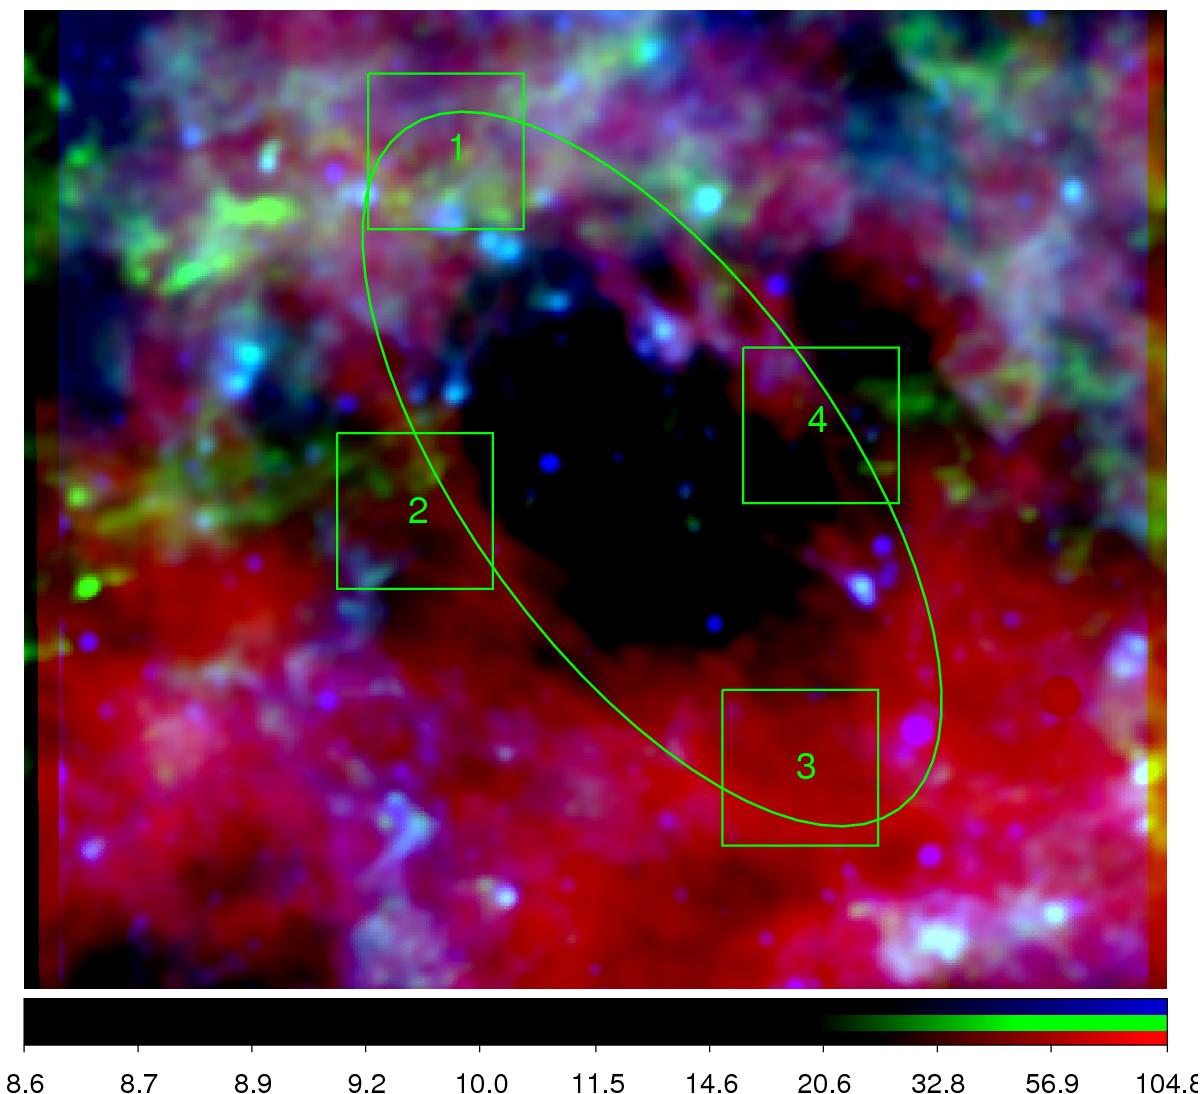
Colour-composite image of the area of GS 118+01−44. Blue shows the emission at 12 μm (W3 WISE band), green represents the emission at 550 μm (Planck), and red shows the mean brightness temperature of the CGPS H i emission distribution between the velocites −41.9 and −47.6 km s-1. The ellipse superimposed is that fitted for the CGPS H i data and the square regions delimit the zones where the fluxes have been calculated.
Current usage metrics show cumulative count of Article Views (full-text article views including HTML views, PDF and ePub downloads, according to the available data) and Abstracts Views on Vision4Press platform.
Data correspond to usage on the plateform after 2015. The current usage metrics is available 48-96 hours after online publication and is updated daily on week days.
Initial download of the metrics may take a while.