Free Access
Fig. 7
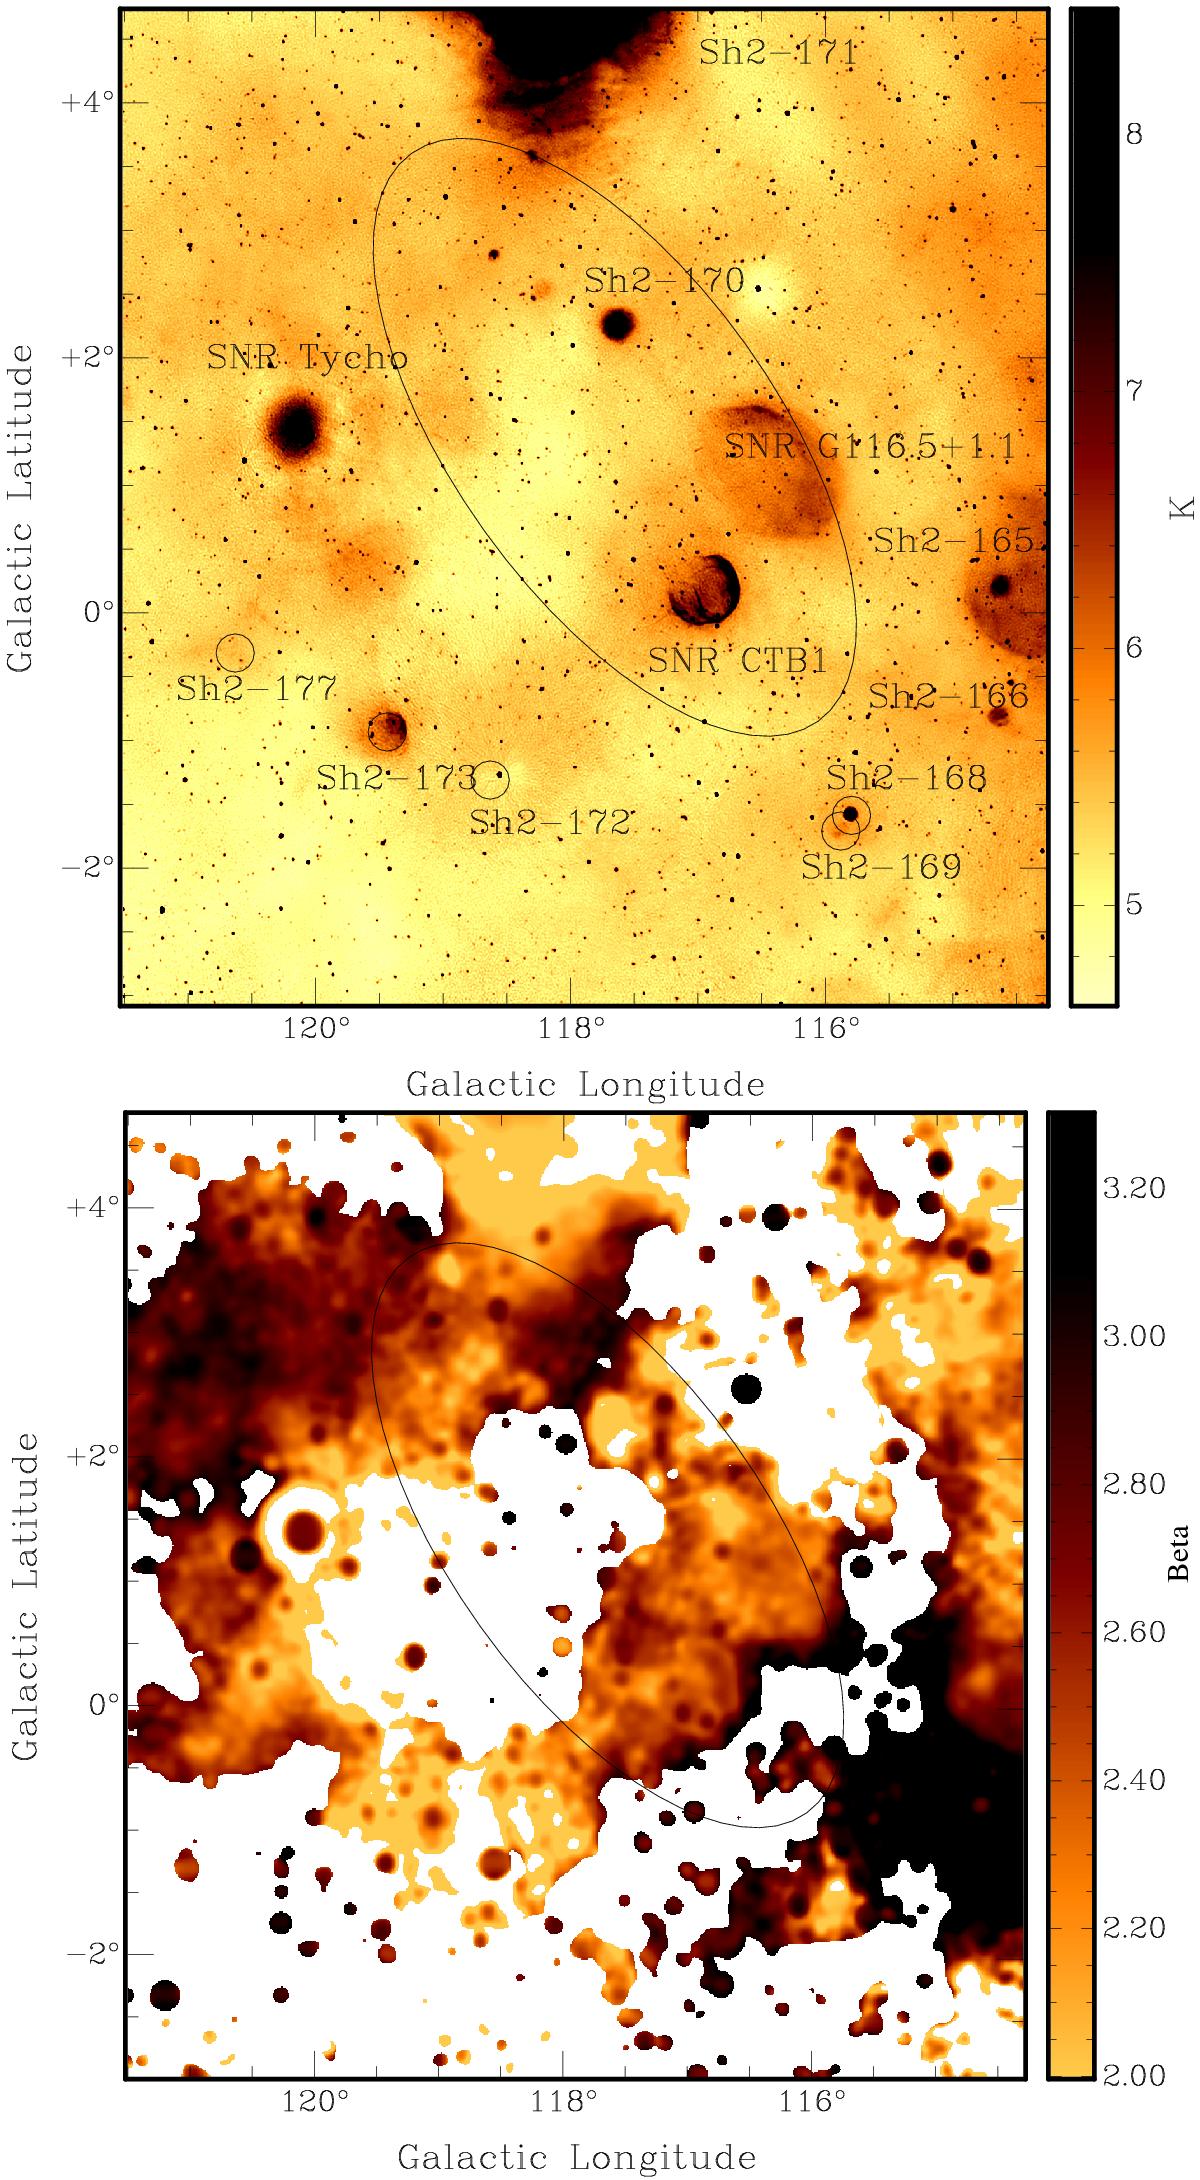
Upper panel: CGPS radio continuum emission at 1420 MHz in the area of GS 118+01−44. The Sharpless H ii regions and SNRs present in the region are labelled. Lower panel: temperature spectral index map. The ellipse delineates the H i supershell location.
This figure is made of several images, please see below:
Current usage metrics show cumulative count of Article Views (full-text article views including HTML views, PDF and ePub downloads, according to the available data) and Abstracts Views on Vision4Press platform.
Data correspond to usage on the plateform after 2015. The current usage metrics is available 48-96 hours after online publication and is updated daily on week days.
Initial download of the metrics may take a while.