Fig. 11
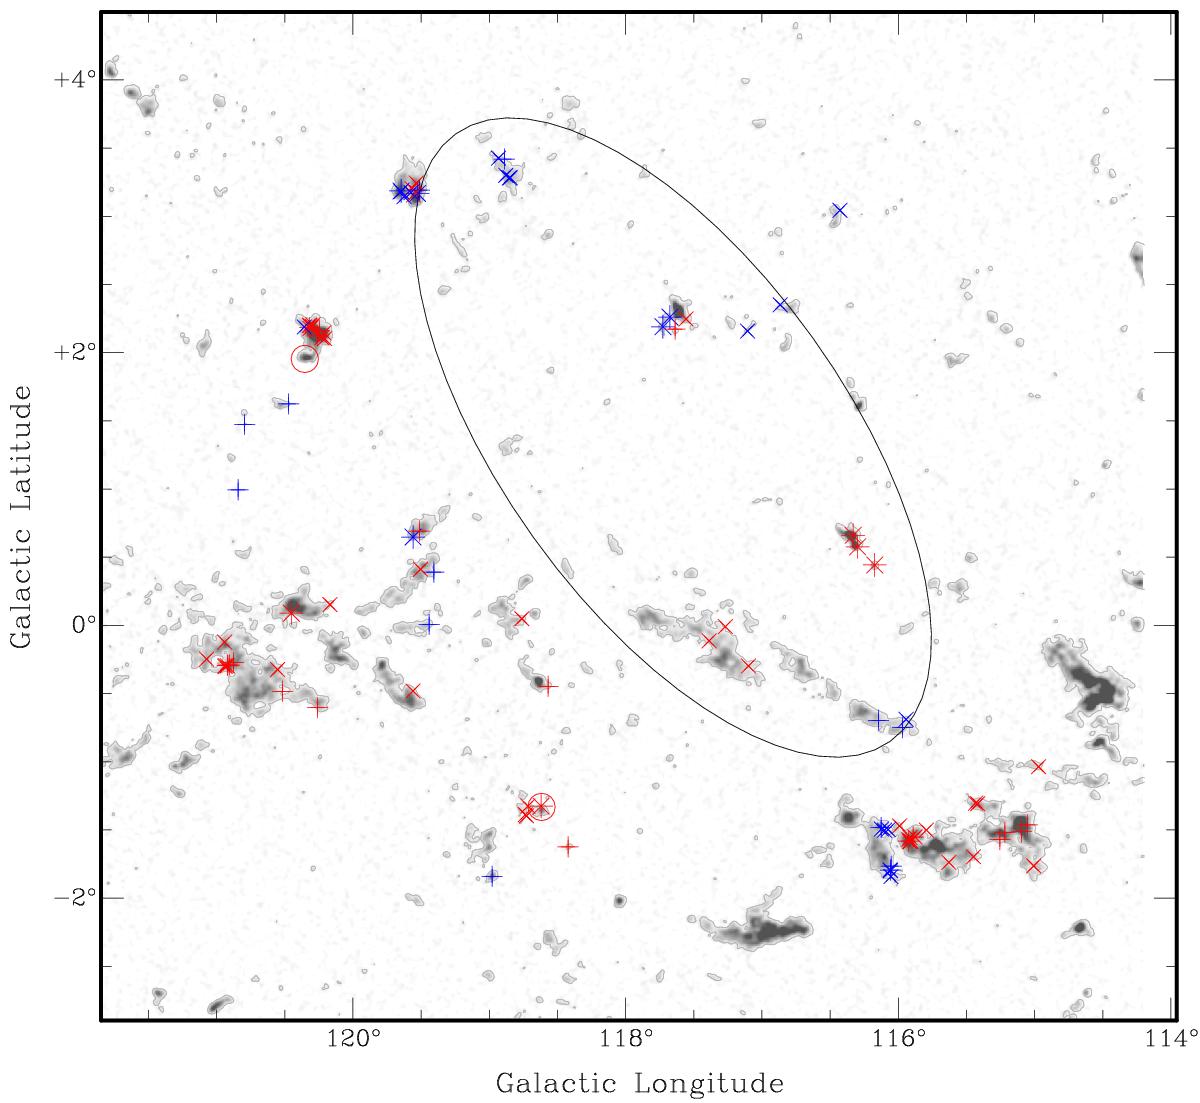
Integrated CO emission distribution in the velocity range from –53 to –40 km s-1. Contour level is at 2.0 K. The location of the cYSOs are indicated with different symbols according to the catalogue where they were found: MSX: circles; IRAS: asteriscs; WISE: plus signs correspond to Class I objects and crosses correspond to Class II. Red and blue indicate objects in which direction there is just one CO component or more than one, respectively.
Current usage metrics show cumulative count of Article Views (full-text article views including HTML views, PDF and ePub downloads, according to the available data) and Abstracts Views on Vision4Press platform.
Data correspond to usage on the plateform after 2015. The current usage metrics is available 48-96 hours after online publication and is updated daily on week days.
Initial download of the metrics may take a while.