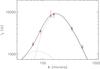
Fig. 10
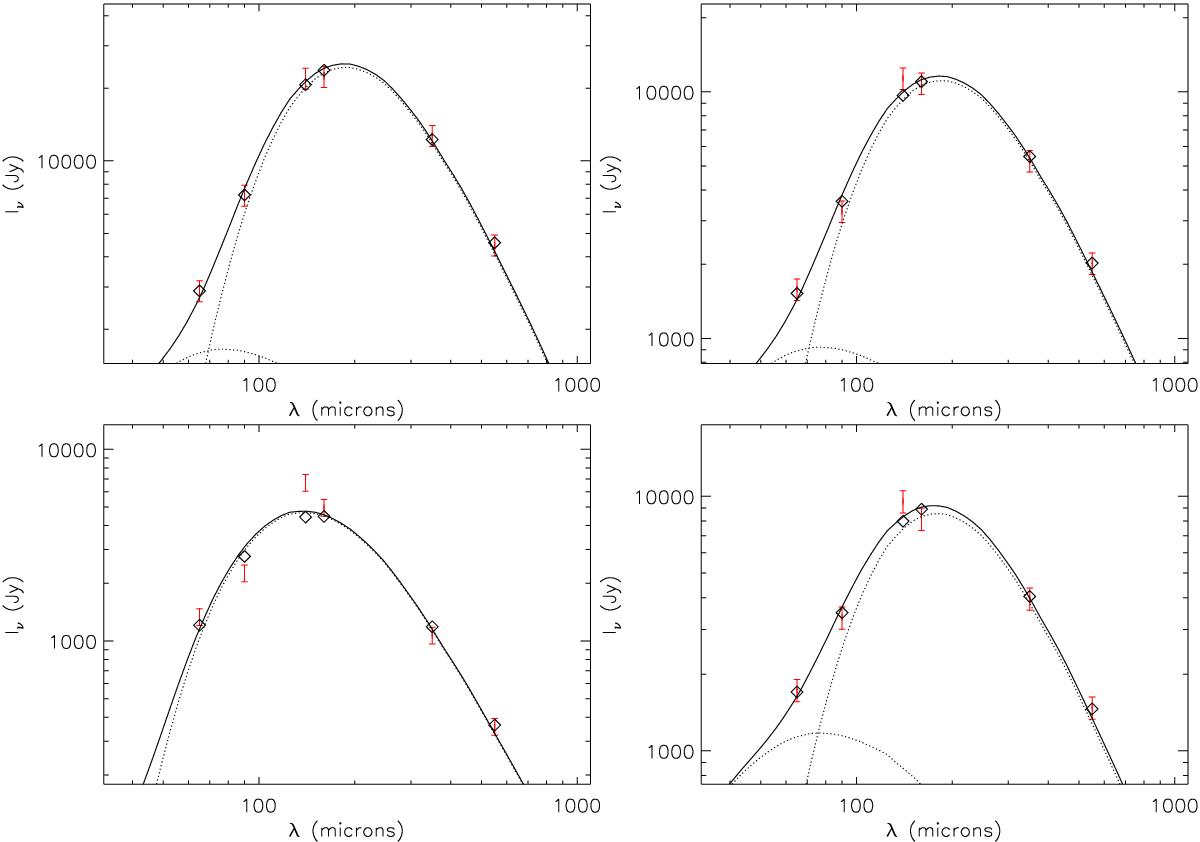
SED of regions number 1 (upper left panel), 2 (upper right panel), 3 (lower left panel), and 4 (lower right panel). Diamonds indicate DUSTEM model prediction and fit. The red error bars denote photometric measurements at 65 μm, 90 μm, 140 μm, and 160 μm (AKARI), 350 μm, and 550 μm (Planck). The solid line shows the VSG+BG model, the dotted line at longer wavelength indicates the BGs, and the dotted line at shorter wavelength indicates the VSGs models.
Current usage metrics show cumulative count of Article Views (full-text article views including HTML views, PDF and ePub downloads, according to the available data) and Abstracts Views on Vision4Press platform.
Data correspond to usage on the plateform after 2015. The current usage metrics is available 48-96 hours after online publication and is updated daily on week days.
Initial download of the metrics may take a while.