Free Access
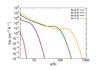
Fig. 7
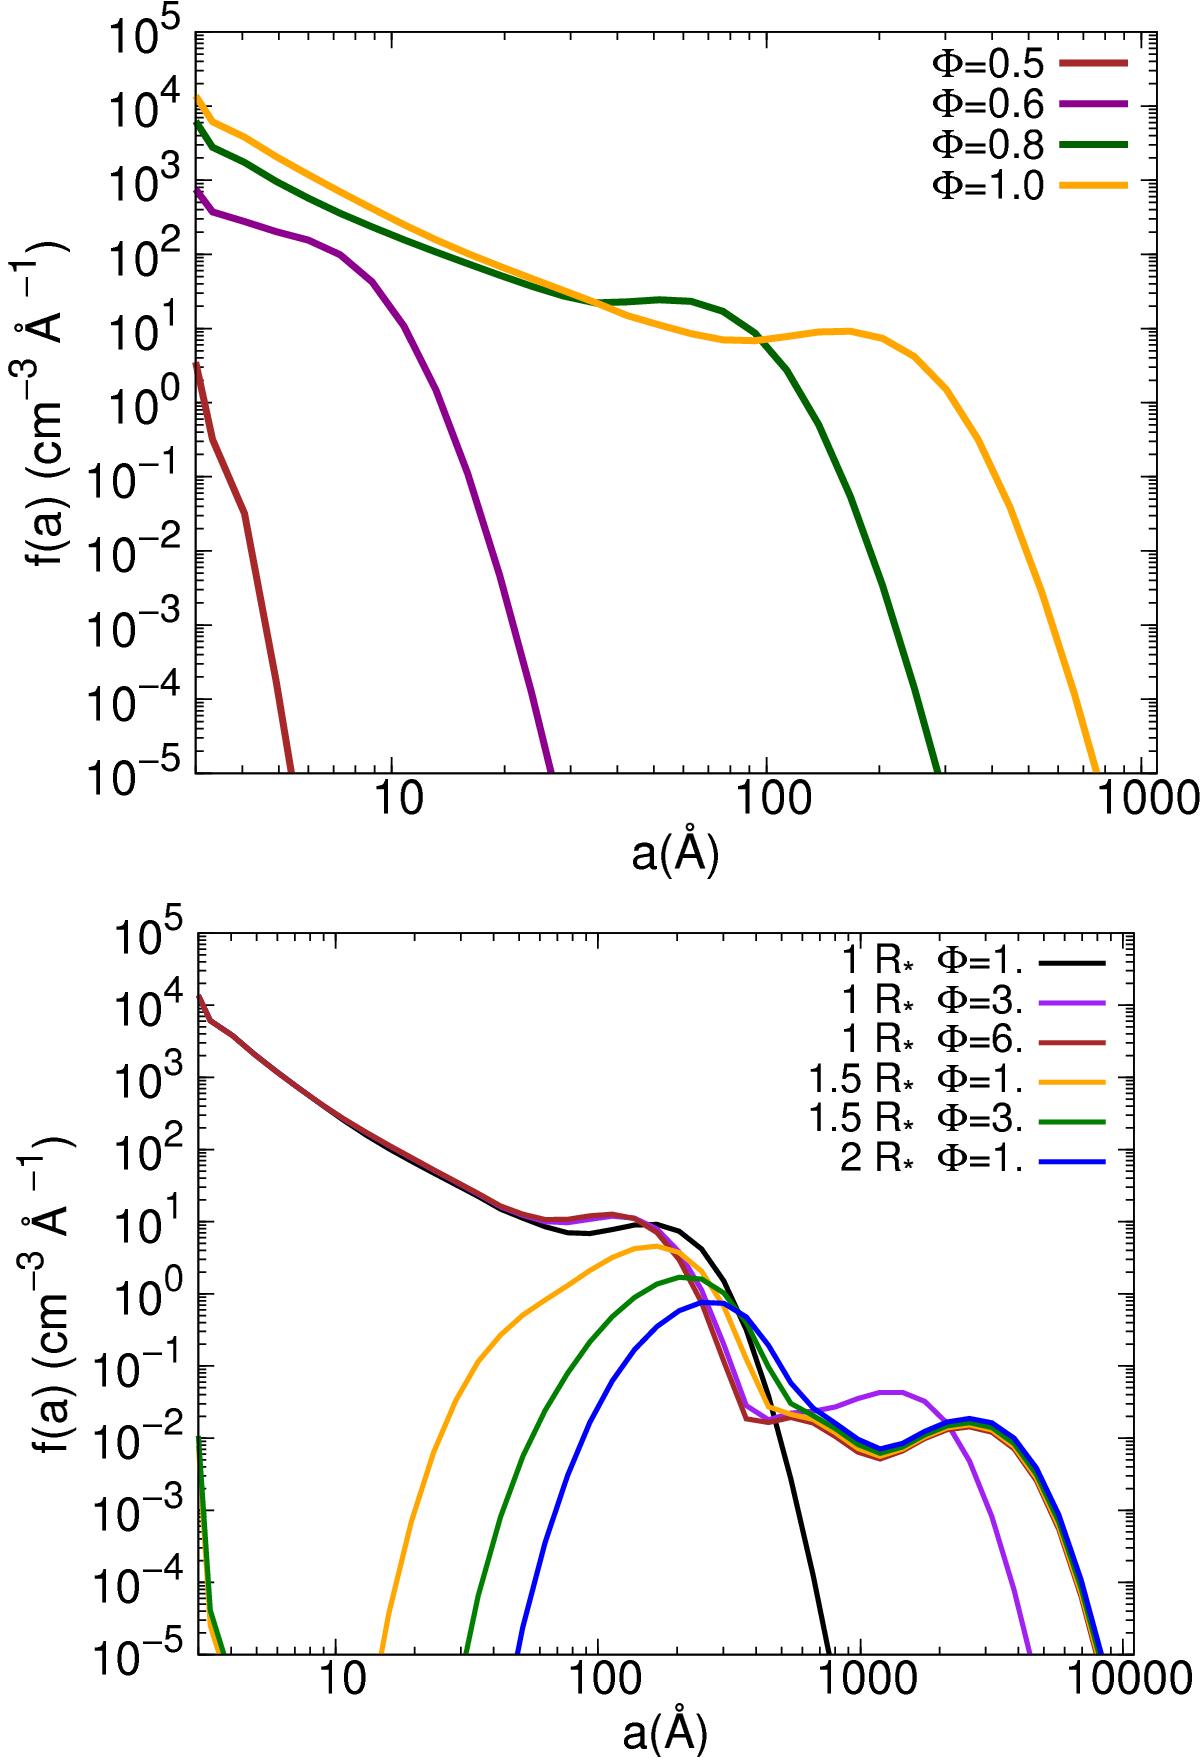
Grain size distributions for alumina dust formed in the shocked gas layer. Top: as a function of phase in one oscillation over one pulsation period at 1 R⋆; bottom: the shocked layer has moved from 1 R⋆ to 2 R⋆. Distributions are shown for different pulsation phases φ (with φ = 1–6) at radius r = 1–2R⋆.
This figure is made of several images, please see below:
Current usage metrics show cumulative count of Article Views (full-text article views including HTML views, PDF and ePub downloads, according to the available data) and Abstracts Views on Vision4Press platform.
Data correspond to usage on the plateform after 2015. The current usage metrics is available 48-96 hours after online publication and is updated daily on week days.
Initial download of the metrics may take a while.