Free Access
Fig. 5
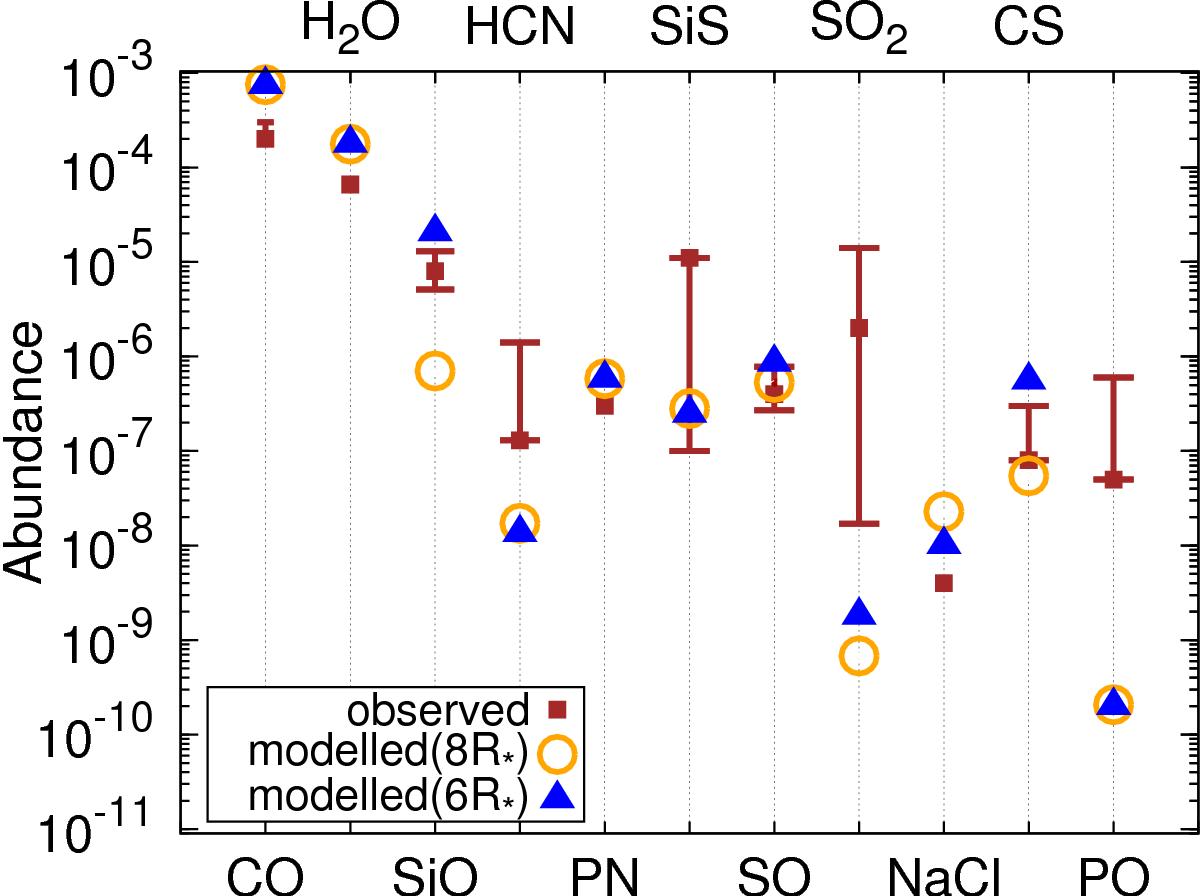
Modelled and observed molecular abundances in the inner wind of IK Tau. The modelled values are for φ = 1, and r = 6R⋆ and 8R⋆. The bars for observed data indicate the value range derived from the different sets of observations listed in Table 5.
Current usage metrics show cumulative count of Article Views (full-text article views including HTML views, PDF and ePub downloads, according to the available data) and Abstracts Views on Vision4Press platform.
Data correspond to usage on the plateform after 2015. The current usage metrics is available 48-96 hours after online publication and is updated daily on week days.
Initial download of the metrics may take a while.